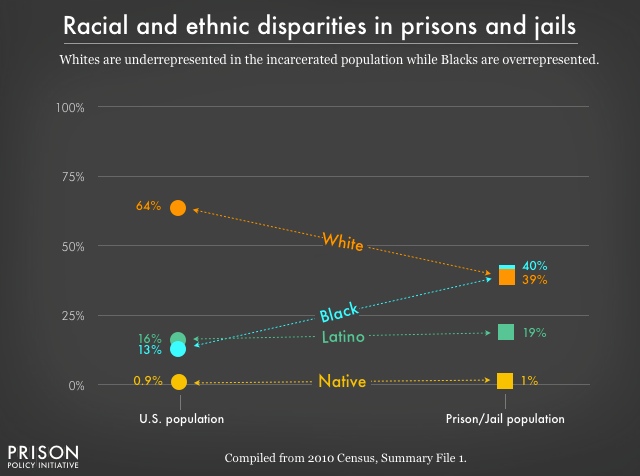
Data Source: Compiled from 2010 Census, Summary File 1. (Graph: Peter Wagner & Bernadette Rabuy, 2016)
This graph originally appeared in Mass Incarceration: The Whole Pie 2016.
Chart comparing the racial and ethnic distribution of the total U.S. population with that of the incarcerated population. Whites are a majority of the total U.S. population, but a minority of the prison population. Blacks, Latinos and Native Americans are a disproportionately larger share of the incarcerated population than they are of the total U.S. population.


