Help us find the facts
We need your support to provide data-driven analysis that makes the case for ending mass incarceration. Our work is possible because of individual contributions. Can you support us today?
Donate
Donate
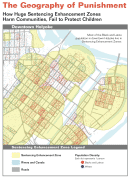
The Geography of Punishment:
How Huge Sentencing Enhancement Zones Harm Communities, Fail to Protect Children
by Aleks Kajstura, Peter Wagner, and William Goldberg
Prison Policy Initiative
July 2008
Section:
Appendix D. Rural/Urban percentages of Hampden County cities and towns.
| Percent rural | Percent urban | Area in square miles | Population per square mile | |
|---|---|---|---|---|
| Agawam | 7.5% | 92.5% | 24.23 | 1,162 |
| Blandford | 100.0% | 0% | 53.55 | 23 |
| Brimfield | 100.0% | 0% | 35.21 | 95 |
| Chester | 100.0% | 0% | 37.12 | 35 |
| Chicopee | 1.5% | 98.5% | 23.9 | 2,287 |
| East Longmeadow | 1.8% | 98.2% | 13.01 | 1,084 |
| Granville | 100.0% | 0% | 42.96 | 35 |
| Hampden | 45.8% | 54.2% | 19.65 | 263 |
| Holland | 100.0% | 0% | 13.09 | 184 |
| Holyoke | 3.5% | 96.5% | 22.82 | 1,746 |
| Longmeadow | 0% | 100.0% | 9.51 | 1,645 |
| Ludlow | 9.5% | 90.5% | 28.23 | 692 |
| Monson | 74.4% | 25.6% | 44.82 | 187 |
| Montgomery | 100.0% | 0% | 15.18 | 43 |
| Palmer | 41.0% | 59.0% | 32.02 | 390 |
| Russell | 94.9% | 5.1% | 17.88 | 93 |
| Southwick | 44.5% | 55.5% | 31.7 | 279 |
| Springfield | 0% | 100.0% | 33.2 | 4,574 |
| Tolland | 100.0% | 0% | 32.77 | 13 |
| Wales | 95.5% | 4.5% | 15.96 | 109 |
| Westfield | 8.9% | 91.1% | 47.31 | 590 |
| West Springfield | 0.4% | 99.6% | 17.54 | 2,285 |
| Wilbraham | 17.2% | 82.8% | 22.42 | 601 |
| Hampden County | 9.7% | 90.3% | 634.07 | 717 |
Recommended Reading:

50 state incarceration profiles
All of our recent reports about prison/jail growth, racial disparities, and more, re-organized by state.

The rapid & unregulated growth of e-messaging in prisons
It can strengthen connections, but instead has been used to sap money from incarcerated people.

Incarceration and supervision by states
Probation and parole are the leading forms of mass punishment in America.

Prison Gerrymandering Project
We are leading the movement to protect our democracy from the Census Bureau's prison miscount.
Events
- July 1, 2026:
On July 1, 2026 at 1 p.m. EST, join the Prison Policy Initiative and guests Jodi Hocking, Executive Director of Return Strong Nevada, and Taj Mahon-Haft PhD, Director of The Humanization Project, as they discuss the importance of family connections, highlight the ways they are under attack, and share strategies to help families fight back.
Register here
Not near you?
Invite us to your city, college or organization.