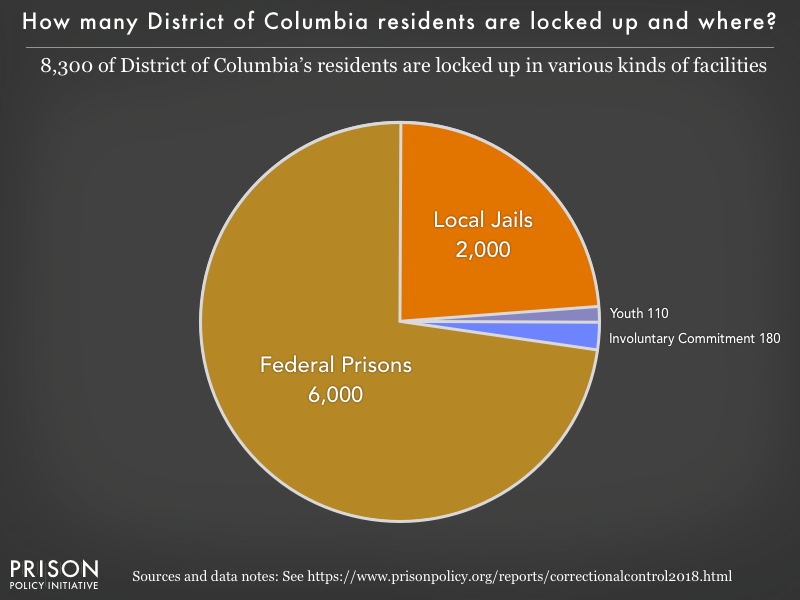
(Graph: Alexi Jones, December 2018)
This graph is a part of Correctional Control 2018: Incarceration and supervision by state. For more research and graphs about District of Columbia, see our District of Columbia state profile.


Events
- June 7, 2024:
Research Director Wendy Sawyer will take part in a panel discussion during the Association of Health Care Journalists conference. The panel, Incarceration as a public health threat, will focus on the ways mass incarceration harms the health of not only incarcerated people but their communities as well.
Communication Director Mike Wessler will also be in attendance for journalists who want to connect.
If you’re a journalist who would like to meet with either, please send us a message.
Not near you?
Invite us to your city, college or organization.