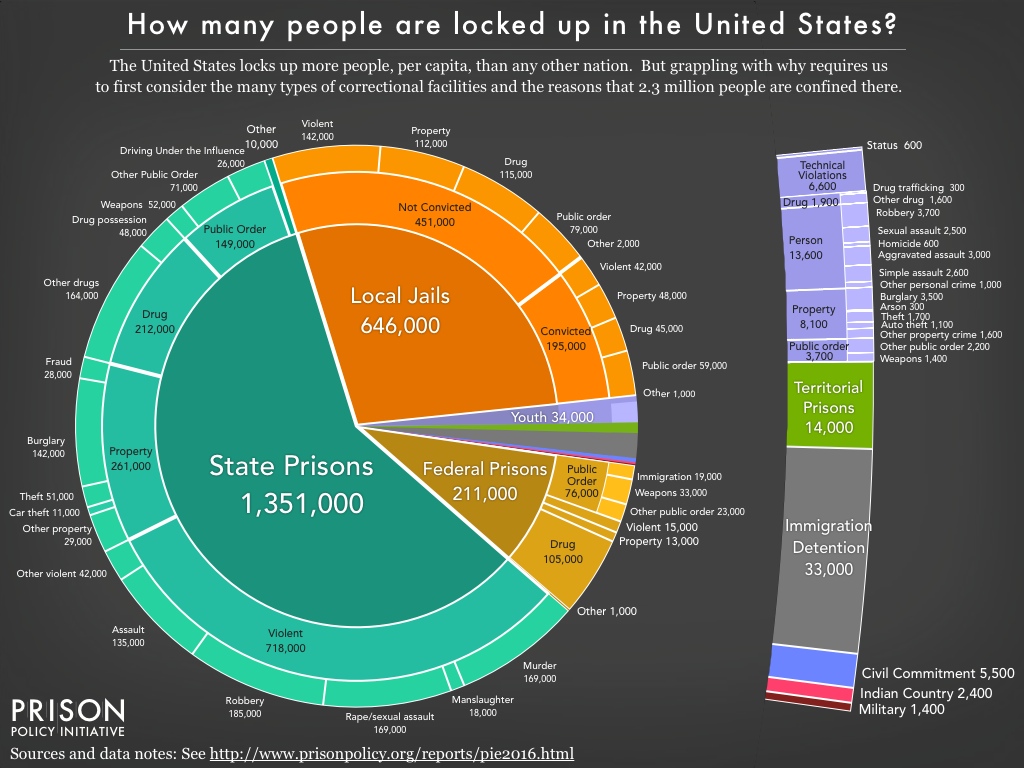
New report, Mass Incarceration: The Whole Pie 2016, pieces together systems of confinement and provides further detail about local jails
This Pi Day, the Prison Policy Initiative has an updated version of its mass incarceration pie chart, including more detail on jails and new infographic slideshows
March 14, 2016
FOR IMMEDIATE RELEASE: March 14, 2016
Contact:
Bernadette Rabuy
brabuy [at] prisonpolicy.org
Easthampton, MA — With 2.3 million people locked up in thousands of correctional facilities operated by various agencies, getting the big picture is anything but easy. Today, with the publication of Mass Incarceration: The Whole Pie 2016, the Prison Policy Initiative provides the answer to how many people are locked up in the U.S., where, and why. Building upon our groundbreaking 2015 and 2014 reports, that, for the first time, aggregated the disparate systems of confinement, this updated version allows the reader to drill deeper, including into the reasons that so many people are locked up in local jails.
As we discuss in the report and accompanying infographics, looking at the “whole pie” allows us to cut through the fog to answer key questions such as:
- After state prisons, what is the next biggest slice of confinement?
- Are there more people in local jails that have been convicted of a crime or have not been convicted?
- How does the number of people that cycle through correctional facilities in a year differ from the number of people locked up on a particular day?
- Are most people in state and federal prisons locked up for drug offenses?
- How many youth are locked up in the U.S. and in what types of facilities?
- How does the number of people in correctional facilities compare to the even larger number of people under the supervision of probation and parole?
Armed with the big picture, Mass Incarceration: The Whole Pie 2016, gives the public and policymakers the foundation to now consider the types of changes that would end the country’s reign as the number one incarcerator in the world.
The Prison Policy Initiative plans to release updated versions of this report each year on Pi Day, March 14.
The report is available at: http://www.prisonpolicy.org/reports/pie2016.html
To embed the report’s infographics into your website or blog, copy and paste the following code:
-30-


