Uncovering Mass Incarceration’s Literacy Disparity
Literacy is a key metric for how our society sets some groups up to fail.
by Corey Michon, April 1, 2016
Although much attention has been dedicated to the fact that educational and job training programs can reduce recidivism amongst people being released from prisons and jails in the United States, policymakers, academics, activists, and citizens alike would do well to devote greater attention to the forms of disadvantage that make people more likely to end up behind bars in the first place. As we demonstrate in our July 2015 report on pre-incarceration incomes of people in prison, the American criminal justice system incarcerates people who had a median annual income 41% less than that of their non-incarcerated counterparts before their incarceration. In this blog post, we examine disparities in literacy rates as another avenue for understanding who ends up behind bars in the world’s largest prison system.
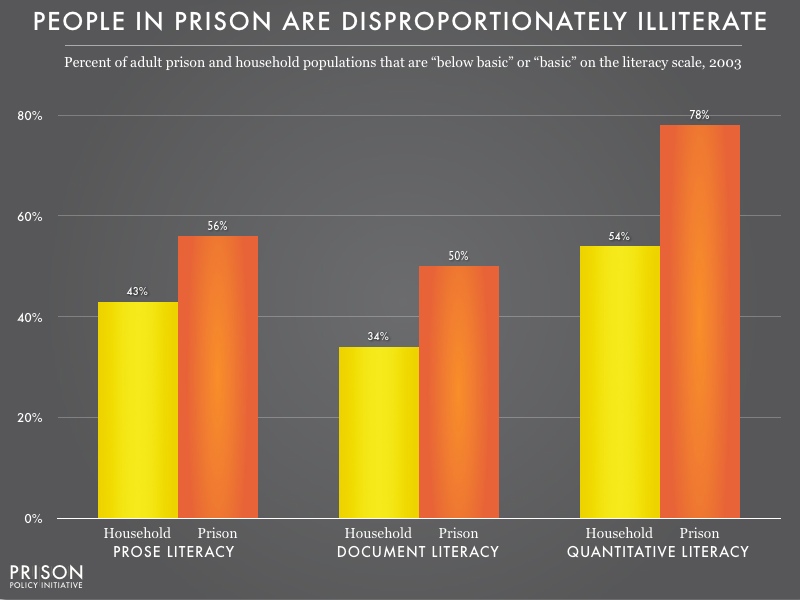
In 2003, the U.S. Department of Education conducted the National Assessment of Adult Literacy (NAAL) survey, assessing the English literacy of incarcerated adults for the first time since 1992. The assessment was administered to approximately 1,200 people incarcerated in state and federal prisons, as well as 18,000 non-imprisoned Americans. The NAAL found that there was a significant difference between the literacy rates between incarcerated individuals and their non-incarcerated counterparts:

People in prison are 13 to 24 percent more represented in the lowest levels of literacy than people in the free world. The smallest disparity is for prose literacy, and the largest disparity is for quantitative literacy. (For an explanation of the different types of literacy, and why “basic” literacy is inadequate for our modern society, see my appendix below.)
The fact that people in prison had significantly lower median incomes before prison than their non-incarcerated counterparts and that people in prison have significantly lower levels of literacy than non-imprisoned individuals show who is most vulnerable to incarceration: those without access to jobs or quality education fill cells, while those with a larger share of the nation’s resources have a far greater chance of avoiding incarceration.
This is not a new fact: poverty, lack of quality education, and little job opportunity have been central to the argument of prison vulnerability for decades. However, the 2003 NAAL study reveals an additional disparity that speaks to the “is it race or class?” debate in mass incarceration:
Looking at the 2003 NAAL study and focusing on the two lowest categories of literacy proficiency, “below basic” and “basic”, reveals striking disparities. Incarcerated Black and Hispanic adults had lower levels of literacy than whites; and incarcerated white adults had lower literacy than non-incarcerated white adults. This is unsurprising. What is notable, however, is that the study also found that Black and Hispanic non-incarcerated adults have lower literacy scores than white adults outside or inside of prison. This data is strong evidence that the U.S. educational system may be failing people along racial lines.
| Percentage of population that has “below basic” or “basic” literacy, by literacy type | ||||
|---|---|---|---|---|
| Literacy type | ||||
| Prose | Document | Quantitative | ||
| Black adults in households | 67% | 59% | 79% | |
| Hispanic adults in households | 74% | 64% | 83% | |
| White adults in prison | 41% | 33% | 64% | |
To me, this data implies that in ending mass incarceration, we will need to grapple with how our educational system is failing large portions of our nation — to the detriment of everyone.
Corey Michon, a graduating Senior at Williams College, wrote this article as part of her 2016 Alternative Spring Break experience at the Prison Policy Initiative. She is looking forward to the publication of updated NAAL data in the summer of 2016.
Appendix: Literacy Types and Literacy Proficiency
Types of Literacy
The 2003 NAAL study address three types of literacy and defines each as the following:
- Prose literacy: The knowledge and skills needed to search, comprehend, and use information from continuous texts. Prose examples include editorials, news stories, brochures, and instructional materials.
- Document literacy: The knowledge and skills needed to search, comprehend, and use information from noncontinuous texts. Document examples include job applications, payroll forms, transportation schedules, maps, tables, and drug or food labels.
- Quantitative literacy: The knowledge and skills needed to identify and perform computations using numbers that are embedded in printed materials. Examples include balancing a checkbook, computing a tip, completing an order form, or determining the amount of interest on a loan from an advertisement.
Categories of Literacy Proficiency
The 2003 NAAL categorizes literacy levels with 4 descriptors (below basic, basic, intermediate, and proficient), and defines each as the following:
- Below Basic: Indicates that an adult has no more than the most simple and concrete literacy skills.
- Basic: Indicates that an adult has the skills necessary to perform simple and everyday literacy activities.
- Intermediate: Indicates that an adult has the skills necessary to perform moderately challenging literacy activities.
- Proficient: Indicates that an adult has the skills necessary to perform more complex and challenging literacy activities.
Examples for Each Type and Category of Literacy
The following are examples of tasks for each type and category of literacy provided by the NAAL 2003 study.
- Below Basic Examples
Prose: Identify what it is permissible to drink before a medical test, based on a short set of instructions.
Document: Circle the date of a medical appointment on a hospital appointment slip.
Quantitative: Add two numbers to complete an ATM deposit slip. - Basic Examples
Prose: Find, in a long narrative passage, the name of the person who performed a particular action.
Document: Determine and categorize a person’s body mass index (BMI) given the person’s height and weight, a graph that can be used to determine BMI based on height and weight, and a table that categorizes BMI ranges.
Quantitative: Calculate the cost of a sandwich and salad, using prices from a menu. - Intermediate Examples
Prose: Explain why the author of a first-person narrative chose a particular activity instead of an alternative activity.
Document: Enter product numbers for office supplies on an order form, using information from a page in an office supplies catalog.
Quantitative: Determine what time a person can take a prescription medication, based on information on the prescription drug label that relates timing of medication to eating. - Proficient Examples
Prose: Compare and contrast the meaning of metaphors in a poem.
Document: Apply information given in a text to graph a trend.
Quantitative: Calculate the yearly cost of a specified amount of life insurance, using a table that gives cost by month for each $1,000 of coverage.


