Data update: Incarcerated population inching down
New data reveals in 2015, the state and federal incarcerated populations declined by 2%
by Wendy Sawyer, December 29, 2016
Today, the Bureau of Justice Statistics released its latest counts of people incarcerated in state and federal prisons and in local jails, and offered some good news. During 2015, the state and federal incarcerated populations declined by 2%, more than it has any year since the Bureau started tracking annual change in 1978. But relative to the exponential growth in the 1980s and 90s, the recent decline in the incarcerated populations has been frustratingly slow. Worse, the “record” decline is in large part the result of one-time changes in the federal system.
Almost half (40%) of this year’s prison population decrease is thanks to a dramatic drop in the federal prison population. In particular, a large-scale, one-time release of 6,000 non-violent drug offenders last fall accounts for 17% of the overall decline.
The current estimates from the Prisoners in 2015 and Jail Inmates in 2015 reports show that the much larger state prison and local jail populations have not fallen much since a short period of steady decline starting in 2008. In contrast to last year’s federal prison population, the combined state prison populations declined about 1% from 2014.
We updated our chart of incarcerated population counts over time to reflect the most recent estimates and demonstrate where the emphasis of our reform efforts needs to be: in the states.
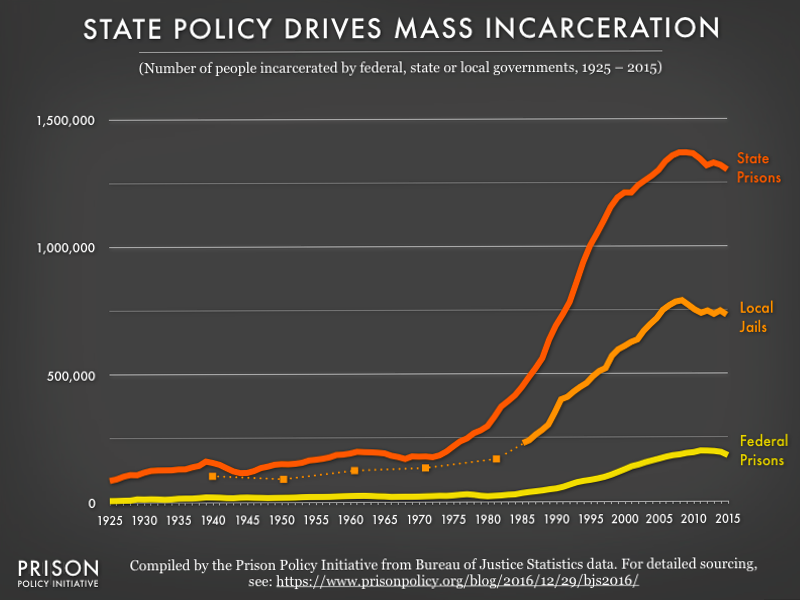
As we noted in our original report on state prison growth, the vast majority of incarcerated people are locked up in state prisons. The justice policies of the 1980s and 1990s led to nearly three decades of mass incarceration, which was concentrated in state and local facilities. Of course, state policies vary significantly, so aggregating them masks the tremendous differences between the states with growing and shrinking prison populations.
Taken together, the state and local incarcerated populations dwarf the federal prison population. To reverse mass incarceration, then, we need to focus our attention on state and local policy.
Data sources for the graph
State prison populations:
- 1925-1977: Bureau of Justice Statistics, Historical Statistics on prisoners in state and federal institutions, yearend 1925-86
- 1978-2004: Bureau of Justice Statistics, Corrections Statistical Analysis Tool (CSAT) – Prisoners, showing the jurisdictional population in “State Institutions (Total)” that has a sentence of at least a year at the end of the given year. Notably, we used the “custom tables” option rather than the quick tables because it appeared that the quick tables did not contain some updates to the data.
- 2005-2015: Bureau of Justice Statistics, Prisoners in 2015, Table 3, which includes the yearend jurisdictional population of state and federal correctional authorities with sentences greater than one year.
Jail populations (midyear estimates, unlike state and federal yearend estimates):
- 1940, 1950, 1960, 1970, 1980: Bureau of Justice Statistics, Historical Corrections Statistics in the United States, 1850 – 1984, Tables 4-1 and 4-2. (We used the columns marked “Census.” Jail data was not available for 1930.)
- 1983-1999: Bureau of Justice Statistics, Sourcebook of Criminal Justice Statistics 1999, Table 6.21
- 2000-2014: Bureau of Justice Statistics, Jail Inmates at Midyear 2014, Table 1
- 2015: Bureau of Justice Statistics, Jail Inmates in 2015, Table 1
Federal prison populations:
- 1925-77: Historical statistics on prisoners in state and federal institutions, yearend 1925-86
- 1978-2014: Bureau of Justice Statistics, Corrections Statistical Analysis Tool (CSAT) – Prisoners, showing jurisdictional population in federal institutions that has a sentence of at least a year at the end of a given year. As above for state prisons, we used custom tables rather than quick tables.
- 2015: Prisoners in 2015, Table 3, which includes the yearend jurisdictional population of state and federal correctional authorities with sentences greater than one year.


