HELP US END MASS INCARCERATION The Prison Policy Initiative uses research, advocacy, and organizing to dismantle mass incarceration. We’ve been in this movement for 23 years, thanks to individual donors like you.

Can you help us sustain this work?

Thank you,
Peter Wagner, Executive Director
Donate

Press Releases archives

Report shows every community is harmed by mass incarceration

July 14, 2022

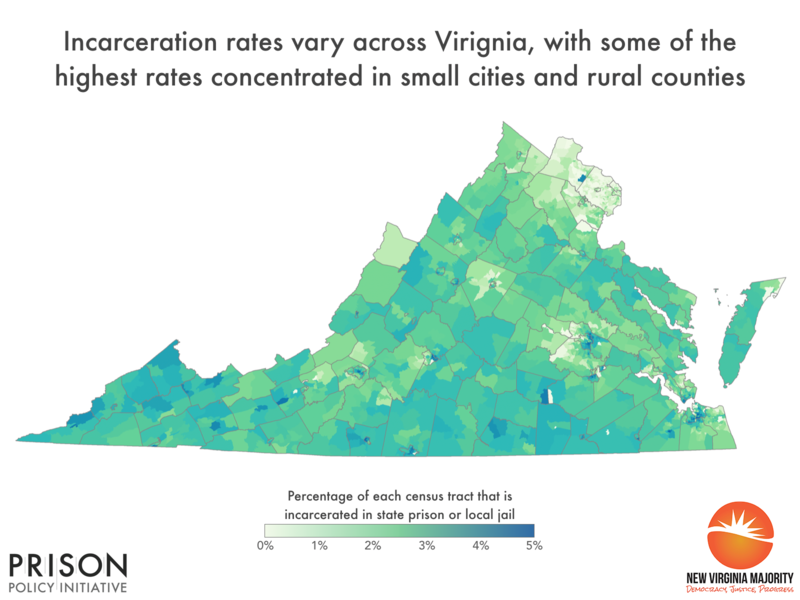
Today the New Virginia Majority and the Prison Policy Initiative released a new report, Where people in prison come from: The geography of mass incarceration in Virginia, that provides an in-depth look at where people incarcerated in Virginia state prisons and local jails come from. The report also provides ten detailed data tables — including neighborhood-specific data for Arlington, Norfolk and Richmond — that serve as a foundation for advocates, organizers, policymakers, data journalists, academics and others to analyze how incarceration relates to other factors of community well-being.

The data and report are made possible by the state’s landmark 2020 law that requires that people in prison and jail be counted as residents of their hometown rather than in prison cells when state and local governments redistrict every ten years.

The report shows:

  • Every single county — and every state legislative district — is missing a portion of its population to incarceration.
  • Many of the state’s least populous counties, including Buchanan, Brunswick, Lee, and Dickinson, have among the highest incarceration rates.
  • There are dramatic differences in incarceration rates within communities. For example, more than half of the people in prison or jail from Richmond come from just 22 of the city’s more than 140 neighborhoods. These neighborhoods have historically been victims of dramatic “redlining”.

Data tables included in the report provide residence information for people in Virginia state prisons and jails at the time of the 2020 Census, offering the clearest look ever at which communities are most impacted by mass incarceration. They break down the number of people locked up by county, city, town, zip code, legislative district, census tract and other areas.

The data show the counties with the highest state prison and local jail incarceration rates are Buchanan (1,246 per 100,000 residents), Brunswick (1,167 per 100,000 residents), Lee (1,155 per 100,000 residents), Dickenson (1,132 per 100,000 residents), and Tazewell (1,105 per 100,000 residents); more than 1% of the residents of each of these counties is behind bars. For comparison, Arlington County has the lowest prison incarceration rate, at 70 people in state prison per 100,000 residents.

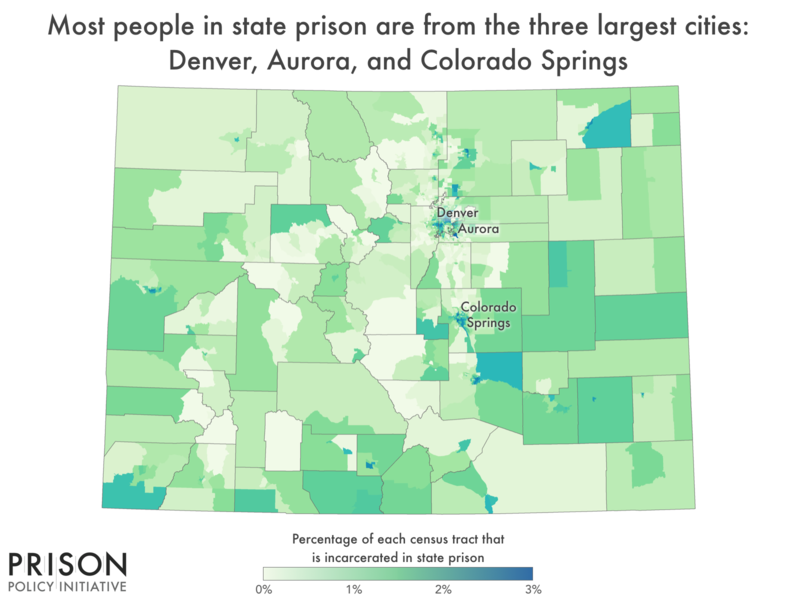
Map of incarceration in Colorado census tracts

“The nation’s 40-year failed experiment with mass incarceration harms each and every one of us. This analysis shows that while some communities are disproportionately impacted by this failed policy, nobody escapes the damage it causes,” said Emily Widra, Senior Research Analyst at the Prison Policy Initiative. “Our report is just the beginning. We’re making this data available so others can further examine how geographic incarceration trends correlate with other problems communities face.”

The report cites studies that show that incarceration rates correlate with a variety of negative outcomes, including higher rates of asthma, depression, lower standardized test scores, reduced life expectancy and more. The data included in this report gives researchers the tools they need to better understand how these correlations play out in Virginia.

“The damage caused by redlining in Richmond and throughout Virginia continues to reverberate to this very day,” said Kenneth Gilliam of the New Virginia Majority. “Considerable work remains to address the inequities that result in people of color disproportionately being locked behind bars. This report and data, though, offer a roadmap for where and how these investments should be made.”

The report is part of a series of reports examining the geography of mass incarceration in America.

Virginia is one of more than a dozen states and 200 local governments that have addressed the practice of “prison gerrymandering,” which gives disproportional political clout to state and local districts that contain prisons at the expense of all other districts. In total, roughly half the country now lives in a place that has taken action to address prison gerrymandering.
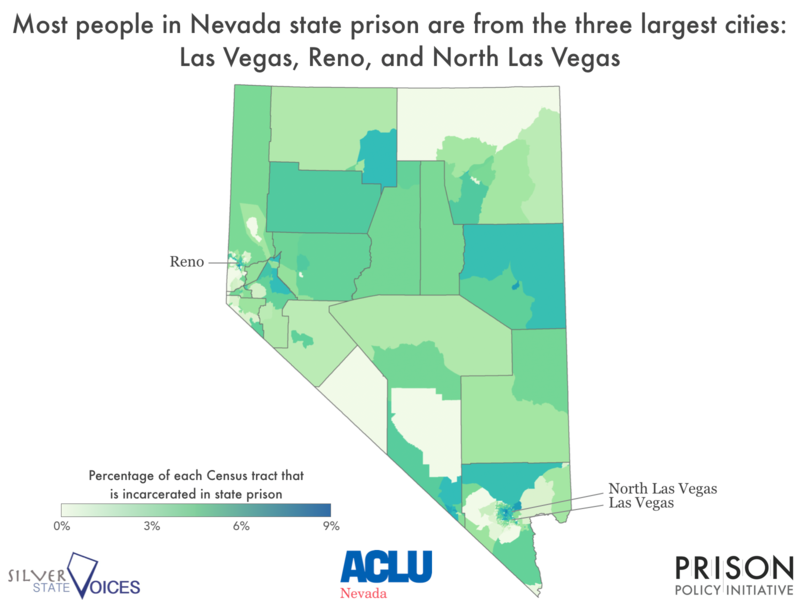
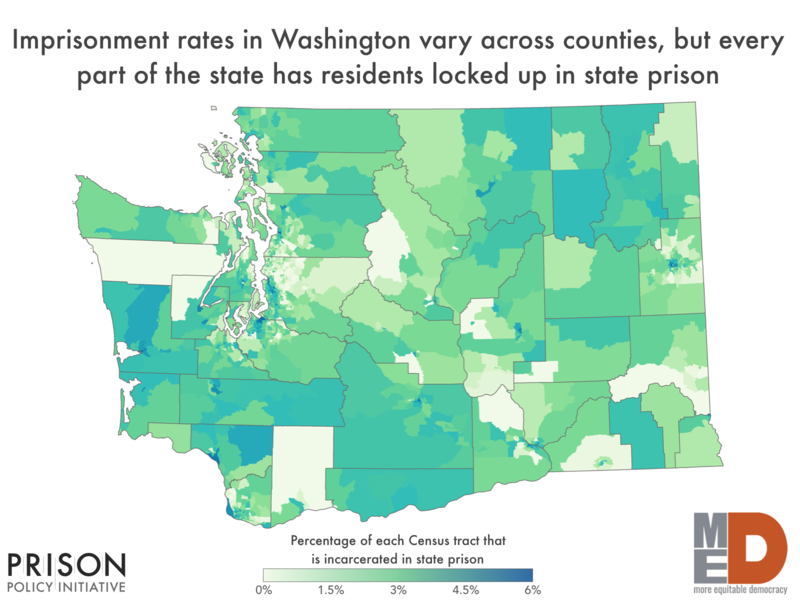
Report shows mass incarceration impacts communities in all corners of the state but disproportionately impacts communities of color

July 7, 2022

Today the Colorado Criminal Justice Reform Coalition and the Prison Policy Initiative released a new report, Where people in prison come from: The geography of mass incarceration in Colorado, that provides an in-depth look at where people incarcerated in Colorado state prisons come from. The report also provides eleven detailed data tables — including local data for Denver, Aurora, and El Paso County — that serve as a foundation for advocates, organizers, policymakers, data journalists, academics and others to analyze the impact of mass incarceration on various communities and provide a roadmap where greater investment in community development is needed to improve community wellbeing.

The data and report were made possible by the state’s landmark 2020 law ending prison gerrymandering. It requires state and local governments to count incarcerated people as residents of their home communities rather than their prison locations when drawing legislative districts.

The report shows:

  • Every Colorado legislative district — and nearly every county — is impacted where a portion of its population is incarcerated in state prisons, however the degree of that impact varies wildly when you drill down into the neighborhood level.
  • Two communities with large Hispanic, Latino, or Native American populations — Alamosa and Bent — have some of the highest imprisonment rates in the state.
  • There are dramatic differences in incarceration rates within communities. For example, in Denver, residents of the Elyria-Swansea neighborhood are 20 times more likely to be imprisoned than residents of nearby Washington Park West.

Data tables included in the report provide residence information for people in Colorado state prisons at the time of the 2020 Census, offering the clearest look ever at which communities are most impacted by mass incarceration. They break down the number of people in state prison up by county, city, town, zip code, legislative district, census tract and other areas.

The counties with the most people in state prison at the time of the 2020 census are Denver (2,712), El Paso (2,378), and Adams (1,599).

Meanwhile, the data show the counties with the highest state prison incarceration rates are Alamosa (577 per 100,000 residents), Pueblo (472 per 100,000 residents) and Bent (465 per 100,000 residents). For comparison, San Juan and Mineral counties have the lowest prison incarceration rates, with no residents in prison.

Map of incarceration in Colorado census tracts

“The nation’s 40-year failed experiment with mass incarceration harms each and every one of us. This analysis shows that while some communities are disproportionately impacted by this failed policy, nobody escapes the damage it causes,” said Emily Widra, Senior Research Analyst at the Prison Policy Initiative. “Our report is just the beginning. We’re making this data available so others can further examine how geographic incarceration trends correlate with other problems communities face.”

The report cites studies that show incarceration rates correlate with a variety of negative outcomes, including higher rates of asthma, depression, lower standardized test scores, reduced life expectancy and more. The data included in this report gives researchers the tools they need to better understand how these correlations play out in Colorado.

“This seminal report is both appalling and not surprising as over-policing and mass incarceration has targeted low-income communities and communities of color for generations,” said Christie Donner of the Colorado Criminal Justice Reform Coalition. “We aren’t facing a crisis of crime, we are facing a crisis of neglect and lack of investment in communities of color and we hope this report will mobilize impacted residents and their elected officials to embrace community development as a public safety strategy.”

The report is part of a series of reports examining the geography of mass incarceration in America.

Colorado is one of more than a dozen states and 200 local governments that have addressed the practice of “prison gerrymandering,” which gives disproportional political clout to legislative districts in which prisons are located, at the expense of other districts. In total, roughly half the country now lives in a jurisdiction that has taken action to address prison gerrymandering.


Report shows every community is harmed by mass incarceration

June 27, 2022

Today the Prison Policy Initiative and Justice Policy Institute released a new report, Where people in prison come from: The geography of mass incarceration in Maryland, that gives an in-depth look at where people in Maryland state prisons come from. The report also provides 9 detailed data tables — including neighborhood-specific data for Baltimore City and Montgomery County — that serve as a foundation for advocates, organizers, policymakers, data journalists, academics, and others to do their own analysis of how incarceration relates to other factors of community well-being.

The report shows:

  • Every single county — and every legislative district — is missing a portion of its population to incarceration in state prison;
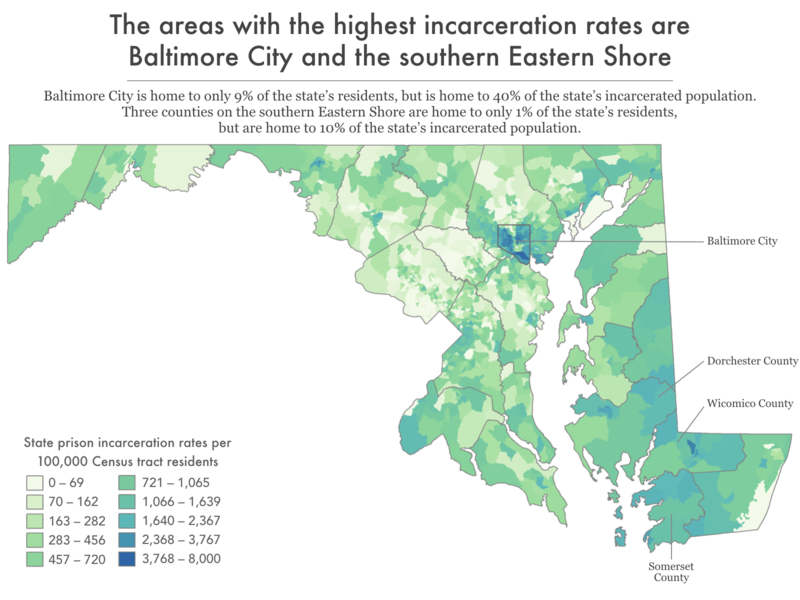
  • No city is harmed by mass incarceration as much as the city of Baltimore. It is home to 9% of the state’s residents, but 40% of people in its state prisons.
  • Smaller and traditionally under-resourced Eastern Shore communities are particularly hard hit by mass incarceration; and
  • The worst impacts of mass incarceration are often concentrated in specific neighborhoods that are already systematically under-resourced. For example, over a third of the people from the city of Baltimore in state prison come from just 10 of the cities 55 neighborhoods.

Data tables included in the report provide residence information for people in Maryland state prisons at the time of the 2020 Census, offering the clearest look ever at which communities are most impacted by mass incarceration. They break down the number of people locked up by county, city, town, zip code, legislative district, census tract, and other areas.

The data show the counties with the highest state prison incarceration rates are Wicomico, Dorchester, and Somerset, all with incarceration rates greater than 500 people in state prison per 100,000 residents. For comparison, Montgomery County has the lowest prison incarceration rate, at 61 people in state prison per 100,000 residents, roughly 10 times lower than the highest counties.

“The nation’s 40-year failed experiment with mass incarceration harms each and every one of us. This analysis shows that while some communities are disproportionately impacted by this failed policy, nobody escapes the damage it causes,” said Emily Widra, Senior Research Analyst at the Prison Policy Initiative. “Our report is just the beginning. We’re making this data available so others can further examine how geographic incarceration trends correlate with other problems communities face.”

A previous analysis from the Prison Policy Initiative and Justice Policy Institute showed a strong correlation between high rates of incarceration in Maryland and high unemployment rates, long commute times, low household incomes, decreased life expectancy, and other markers of low community well-being.

The data and report are made possible by the state’s landmark 2010 law that requires that people in prison be counted as residents of their hometown rather than in prison cells when state and local governments redistrict every ten years. Maryland was the first state in the nation to end the practice of “prison gerrymandering,” which gave disproportional political clout to state and local districts that contain prisons at the expense of all of the other areas of the state. Since then, more than a dozen states and 200 local governments have taken steps to end the practices. In total, roughly half the country now lives in a place that has taken action to address prison gerrymandering.

June 22, 2022

A new report from the Prison Policy Initiative offers the most recent national data on incarcerated people’s health, and shows that U.S. state prisons are continuing to ignore the plight of people in their care. The report, Chronic Punishment: The unmet health needs of people in state prisons, examines the Bureau of Justice Statistics’s Survey of Prison Inmates and breaks down the prevalence of several chronic conditions in this country’s 1,566 state prisons. The report also takes a deep dive into the medical histories of people behind bars.

Key findings in Chronic Punishment include:

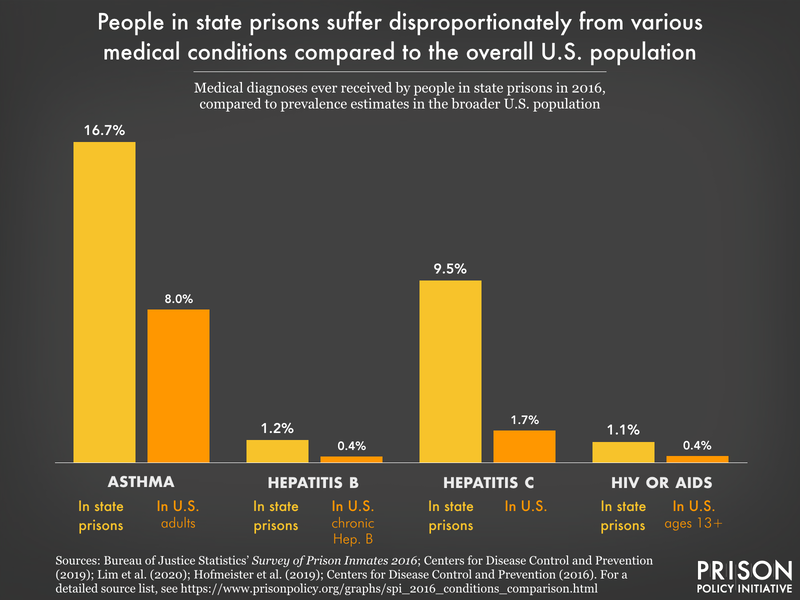
  • People in state prisons suffer disproportionately from asthma, hepatitis C, HIV, and substance use disorder.
  • Significant numbers of people in state prisons also suffer from illnesses such as heart disease, hypertension, and diabetes, which are exacerbated behind bars.
  • Half (50%) of people in state prisons lacked health insurance upon the arrest that led to their incarceration, and those with insurance disproportionately received Medicaid, a sign that poverty, exclusion from the healthcare system, and incarceration overlap significantly in this country.
Health disparities in prison graph

Other standout findings in the report suggest that state prisons, nationally, are not treating medical problems among incarcerated people:

  • Four in 10 (43%) people in state prison report one or more diagnosed mental health conditions, and women’s rates are even higher. Yet only about one-fourth (26%) have received some sort of professional help for their mental health since entering prison.
  • 19% of people in state prisons report having gone without a single health-related visit since entering prison.
  • Existing research suggests that many people who go to prison die prematurely: Cancer is more deadly in prison than on the outside, and people recently released from prison have a higher risk of hospitalization and death from heart disease than the average person. In the first two weeks after release from prison, individuals face a risk of death that is more than 12 times higher than for non-incarcerated individuals.

The report, which includes 15 powerful data visualizations, analyzes how the typical individual in state prison lacked healthcare long before their incarceration and how prison doctors often diagnose problems that prisons lack the capacity to treat. The report takes a particularly close look at how incarcerated women fare medically, including a section about the treatment of people who are pregnant.

Chronic Punishment is the second installment in the Prison Policy Initiative’s analysis of the 2016 Survey of Prison Inmates, a national dataset released last year that offers the most thorough and recent demographic picture of people behind bars in the U.S. This report follows the Prison Policy Initiative’s recent report Beyond the Count about the adverse life experiences of people behind bars. The data cannot be disaggregated by state.

The full report is available at: https://www.prisonpolicy.org/reports/chronicpunishment.html


Report shows every community is harmed by mass incarceration

June 16, 2022

Today the New Jersey Institute for Social Justice and the Prison Policy Initiative released a new report, Where people in prison come from: The geography of mass incarceration in New Jersey, that provides an in-depth look at where people incarcerated in New Jersey state prisons come from. The report also provides eight detailed data tables — including neighborhood-specific data for Newark and Jersey City — that serve as a foundation for advocates, organizers, policymakers, data journalists, academics and others to analyze how incarceration relates to other factors of community well-being.

The data and report are made possible by the state’s landmark 2020 law that requires that people in prison be counted as residents of their hometown rather than in prison cells when state and local governments redistrict every ten years.

The report shows:

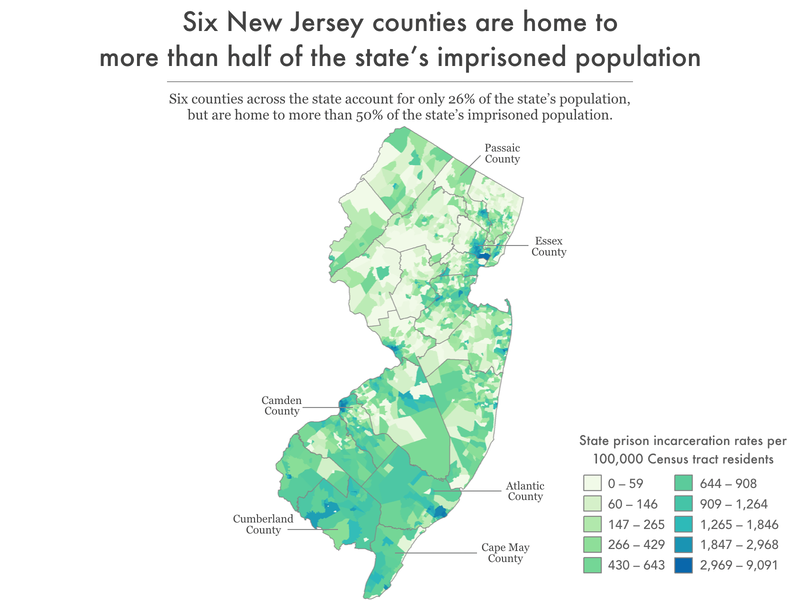
  • Every single county — and every state legislative district — is missing a portion of its population to incarceration in state prison.
  • Many of the state’s smallest counties, including Cumberland, Cape May and Salem, have among the highest incarceration rates in the Garden State.
  • There are dramatic differences in incarceration rates within communities. For example, in Newark, one of the most racially segregated cities in the nation, residents of the Belmont neighborhood are more than four times as likely to be imprisoned than residents of neighboring University Heights.

Data tables included in the report provide residence information for people in New Jersey state prisons at the time of the 2020 Census, offering the clearest look ever at which communities are most impacted by mass incarceration. They break down the number of people locked up by county, city, town, zip code, legislative district, census tract and other areas.

The data show the counties with the highest state prison incarceration rates are Cumberland (444 per 100,000 residents), Atlantic (364 per 100,000 residents) and Essex (351 per 100,000 residents). For comparison, Hunterdon County has the lowest prison incarceration rate, at 28 people in state prison per 100,000 residents, which is nearly 16 times lower than Cumberland County.

“The nation’s 40-year failed experiment with mass incarceration harms each and every one of us. This analysis shows that while some communities are disproportionately impacted by this failed policy, nobody escapes the damage it causes,” said Emily Widra, Senior Research Analyst at the Prison Policy Initiative. “Our report is just the beginning. We’re making this data available so others can further examine how geographic incarceration trends correlate with other problems communities face.”

The report cites studies that show that incarceration rates correlate with a variety of negative outcomes, including higher rates of asthma, depression, lower standardized test scores, reduced life expectancy and more. The data included in this report gives researchers the tools they need to better understand how these correlations play out in New Jersey.

“Eliminating prison-based gerrymandering in New Jersey was not only a huge win for achieving fairer representation for incarcerated people, but it also allows us to see, down to the neighborhood-level, the true costs of mass incarceration in New Jersey,” said Henal Patel, Director of the Democracy & Justice Program at the New Jersey Institute for Social Justice. “The availability of this new data makes room for much more targeted and robust policy solutions to some of the often race-related inequities in the Garden State.”

This is the second in a series of reports examining the geography of mass incarceration in America.

New Jersey is one of more than a dozen states and 200 local governments that have addressed the practice of “prison gerrymandering,” which gives disproportional political clout to state and local districts that contain prisons at the expense of all of the other areas of the state. In total, roughly half the country now lives in a place that has taken action to address prison gerrymandering.

Report shows every community is harmed by mass incarceration, particularly in upstate New York

June 6, 2022

Today, the Prison Policy Initiative and VOCAL-NY released a new report, Where people in prison come from: The geography of mass incarceration in New York, that gives an in-depth look at where people in New York state prisons come from. The report also provides 13 detailed data tables — including neighborhood-specific data for New York City, Buffalo, Syracuse, and Yonkers — that serve as a foundation for advocates, organizers, policymakers, data journalists, academics, and others to do their own analysis of how incarceration relates to other factors of community well-being.

The report shows:

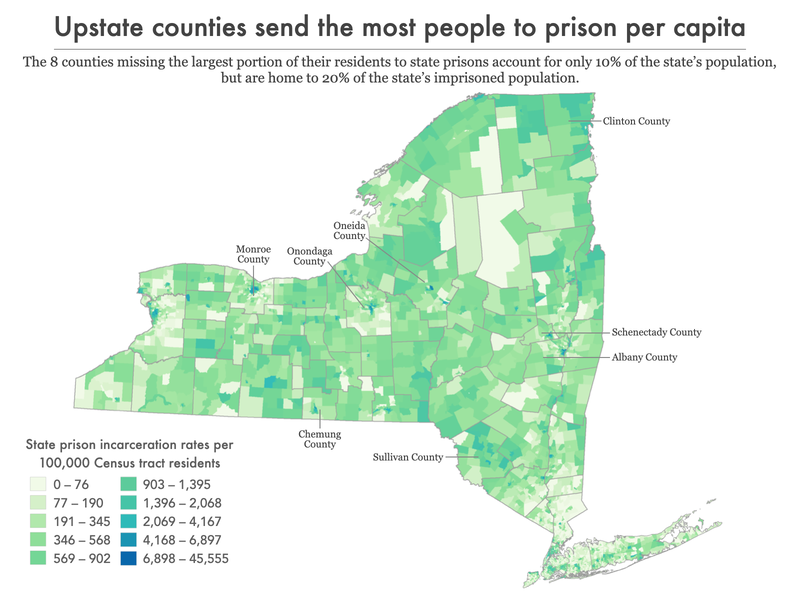
  • Every single county — and every Assembly and Senate district — is missing a portion of its population to incarceration in state prison;
  • Upstate communities, including some of the least populous counties, have disproportionately high state prison incarceration rates; and
  • The worst impacts of mass incarceration are often concentrated in specific neighborhoods that are already systematically under-resourced. For example, more than a quarter of everyone in state prison from Syracuse comes from just 4 of that city’s 32 neighborhoods.

Data tables included in the report provide residence information for people in New York State prisons at the time of the 2020 Census, offering the clearest look ever at which communities are most impacted by mass incarceration. They break down the number of people locked up by county, city, town, zip code, legislative district, census tract, and other areas.

The data show the six counties with the highest state prison incarceration rates are upstate: Schenectady, Albany, Monroe (Rochester), Oneida (Utica), and Onondaga (Syracuse). Additionally, New York City had a state imprisonment rate below the state average, more than five times lower than Rochester, and more than four times lower than Syracuse and Albany.

map showing the Census tracts in NY with the highest incarceration rates

“The nation’s 40-year failed experiment with mass incarceration harms each and every one of us. This analysis shows that while some communities are disproportionately impacted by this failed policy, nobody escapes the damage it causes,” said Emily Widra, Senior Research Analyst at the Prison Policy Initiative. “Our report is just the beginning. We’re making this data available so others can further examine how geographic incarceration trends correlate with other problems communities face.”

The report also highlights other studies that show a correction between areas in the state with high incarceration rates and a wide range of negative consequences, including lower life expectancy, increased rates of asthma (including in children), and lower standardized test scores.

“This data allows us better understand the full scale of the devastation mass incarceration has brought to communities across New York,” said Nick Encalada-Malinowski, of VOCAL-NY. “More importantly though, it can be used as a roadmap for leaders who are committed to breaking the cycle of incarceration by investing in the communities that need it most.”

The data and report are made possible by the state’s landmark 2010 law that requires that people in prison be counted as residents of their hometown rather than in prison cells when state and local governments redistrict every ten years. New York was among the first states in the nation to end the practice of “prison gerrymandering,” which gave disproportional political clout to state and local districts that contain prisons at the expense of all of the other areas of the state. Since then, more than a dozen states and 200 local governments have taken steps to end the practices. In total, roughly half the country now lives in a place that has taken action to address prison gerrymandering.

People in prisons have endured disadvantage and poverty all the way back to childhood, the Prison Policy Initiative's new report shows.

April 13, 2022

This morning, the Prison Policy Initiative published Beyond the Count, a report that examines the most recent and comprehensive demographic data about people in state prisons and provides a groundbreaking view of the lives of incarcerated people before they were locked up. The report’s findings make clear that solving this country’s mass incarceration crisis will require policy changes that begin outside the prison walls and tackle the inequities and disadvantages incarcerated people face early in their lives.

The report analyzes data from the Bureau of Justice Statistics’ “Survey of Prison Inmates,” collected in 2016 and released in late 2020. The data show what many in the criminal justice reform movement already know: that the U.S. criminal justice system today locks up the least powerful people in society. Key takeaways include:

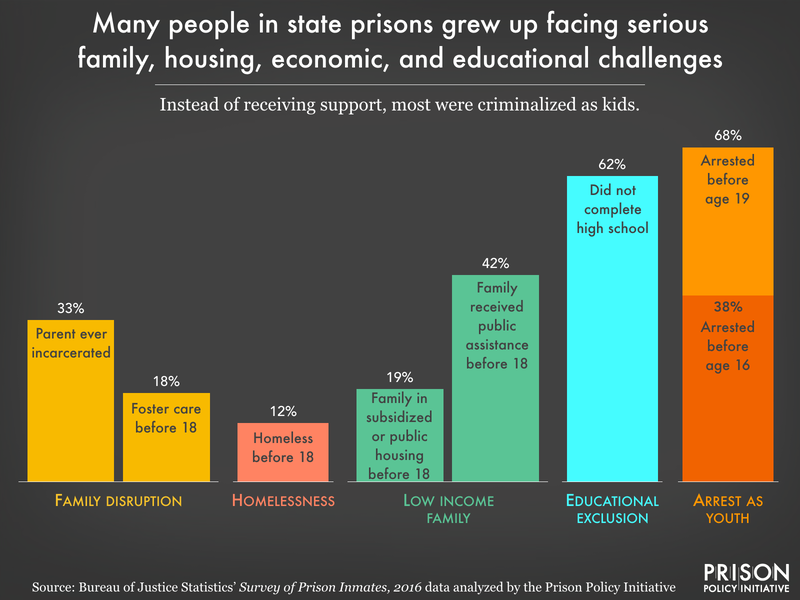
  • Many, if not most, people in prison grew up struggling financially. 42% of survey respondents said their family received public assistance before they were 18. Respondents also reported uncommonly high levels of homelessness, foster care, and living in public housing before the age of 18.

childhood disadvantages graph

  • Most individuals in state prisons report that their first arrest happened when they were children. 38 percent of the people BJS surveyed reported a first arrest before age 16, and 68% reported a first arrest before age 19. The average survey respondent had been arrested over 9 times in their life.
  • The typical person in state prison is 39 years old and has a 10th grade education, a fact that is most likely linked to youth confinement, which disrupts a young person’s life and schooling.
  • Half (49%) of people in state prisons meet the criteria for substance use disorder (SUD), and 65% were using an illicit substance in the immediate lead-up to their incarceration, suggesting that many people who are not locked up for drug offenses are still victims of our country’s choice to criminalize substance use rather than treat it as a health issue.

The Prison Policy Initiative’s report includes more than 20 detailed data tables that allow readers to better understand the people who are in state prisons and the challenges they have faced in their lives. Beyond the Count also includes a section diving into the data on the race, age, gender identity, and sexual orientation of people in state prisons, explaining that a disproportionate number of incarcerated people are racial minorities, very young or very old, or LGBTQ. Many of the key demographic findings in Beyond the Count (such as incarcerated people’s age at first arrest) are also broken down by race or gender.

While the data in this report is about people in state prisons, it does not allow statistics to be broken out for individual states.

“What the data in our new report show is that this country is locking up the same people it has failed by not investing in things like good healthcare, housing, and education for all,” said report author Leah Wang. “What’s worse, the data show that most disadvantaged people’s encounters with the justice system begin during childhood, when they are arrested rather than given the care and attention they need as young people.”

The full report is available at https://www.prisonpolicy.org/reports/beyondthecount.html.


The report includes 31 visualizations of criminal justice data, exposing long-standing truths about mass incarceration in the U.S.

March 14, 2022

Today, the Prison Policy Initiative released Mass Incarceration: The Whole Pie 2022, compiling national data sources to offer the most comprehensive view of how many people are locked up in the U.S. — and where they are being held — since the COVID-19 pandemic began. The report explains how the pandemic has impacted prison and jail populations, and pieces together the most recent national data on state prisons, federal prisons, local jails, and other systems of confinement to provide a snapshot of mass incarceration in the U.S.

A pie chart show where people are incarcerated in the U.S.

Highlights from the report include:

  • Prison populations fell by about 16% during the pandemic. However, 10% fewer people were released from prison during 2020 than in 2019, and preliminary data suggests that fewer still were released in 2021, meaning that people leaving prison did not drive the population drop. Instead, the reduction was due to reductions in prison admissions, largely due to pandemic-related slowdowns in the criminal legal system.
  • Local jail populations fell about 13% during the pandemic. Since then, a sample of over 400 jails shows that jail populations are returning to pre-pandemic levels and more than a quarter of jails have higher populations today than before COVID-19.
  • In total, roughly 1.9 million people are incarcerated in the United States.

“Even when the U.S. prison population was at a historically low point in the pandemic, we were still locking up far more people per capita than any other country on earth,” said Wendy Sawyer, Research Director for the Prison Policy Initiative and co-author of the report. “It’s important for people to understand that the temporary population drops during the pandemic were due to COVID jamming the gears of the criminal justice system — not because of any coordinated actions to reform the system.”

The report includes 31 visualizations of criminal justice data, exposing other long-standing truths about incarceration in the U.S.:

  • The U.S. continues to lock up hundreds of thousands of people pretrial every day. A rise in the use of money bail over the last 40 years has driven an increase in pretrial populations.
  • Black people are still overrepresented behind bars, making up about 38% of the prison and jail population.
  • At least 113 million adults in the U.S. (or over 40%) have a family member who has been incarcerated, and 79 million people have a criminal record, revealing the ripple effects of locking up millions of people every day.

The report also tackles frequent misconceptions about mass incarceration related to prison labor, the war on drugs, private prisons, what victims of crime want, and community supervision.

“As the pandemic eases, and with incarceration rates as low as they’ve been in decades, elected leaders face a choice. They can take bold action to continue to reduce the number of people behind bars and invest in community responses that address the core causes of crime — poverty, addiction, and mental health struggles — or they can return to business as usual with incarceration rates stubbornly stuck at globally high rates and ballooning correctional budgets that burn through tax dollars without making communities safer and stronger,” said Sawyer. “The Whole Pie should serve as a call to action for government to finally end our nation’s failed experiment of mass incarceration.”

The Prison Policy Initiative traditionally releases a new version of its Whole Pie report annually however, COVID-related delays in the release of government-produced data prevented the organization from releasing a new version in 2021.

Read the full report, with detailed data visualizations at: https://www.prisonpolicy.org/reports/pie2022.html.


Each will help propel the Prison Policy Initiative with new ideas, new energy and new partnerships.

March 4, 2021

Contact: prisonpolicy.board@gmail.com

(Northampton, MA) – The Prison Policy Initiative, a leading research organization in the field of criminal justice, added five new directors to the board of directors to help foster strategic growth. The new members will serve three-year terms:

  1. Sharon Cromwell, Deputy State Director, New York Working Families Party
  2. Ed Epping, AD Falck Professor of Art, Emeritus, Williams College
  3. Timothy Fisher, Professor of Law and former Dean, University of Connecticut School of Law
  4. Leslie M. Smith, IBM Business Development Executive (retired) and Founder / CEO DistancEd. Inc
  5. Paul Watterson, Of Counsel, Schulte Roth & Zabel LLP

“The Prison Policy Initiative is proud to welcome these five leaders to our board. Each will help propel the Prison Policy Initiative with new ideas, new energy and new partnerships” said the Board’s President, Elena Lavarreda, NJ Political Director, SEIU 32BJ.

Also welcoming the new members are: Nora V. Demleitner, Director, Professor of Law, Washington and Lee University School of Law, Daniel Kopf, Board Treasurer, Data Editor, San Francisco Chronicle, and Bernadette Rabuy, Board Clerk, Trial Attorney, Homicide/Major Crime Defense Unit, New York County Defender Services.

In January, the Board participated in a two-day retreat where they set their goals for the coming year, including recruiting additional directors to the Board. “We’re looking forward to supporting the Prison Policy Initiative at this critical transition point, as they welcome new senior staff, including a Director of Advocacy and Communications Director, and expand as an organization with staff in several states,” said Leslie M. Smith, one of the new directors and Founder/CEO DistancEd. Inc., a non-profit that trains computer skills to formerly incarcerated people. Another new director, Ed Epping, shared his excitement about the Prison Policy Initiative’s plans, “The Prison Policy Initiative’s insightful data analysis and powerful graphics have long fueled the national movement for criminal justice reform by filling in key messaging and data gaps. We’re looking forward to supporting the Prison Policy Initiative as it begins to have the dedicated staff and capacity to outreach to local, state, and national advocates and support them with our research.”

The Prison Policy Initiative (https://www.prisonpolicy.org/) was co-founded by Peter Wagner in 2001 to document and publicize how mass incarceration punishes our entire society. Since its inception, the Prison Policy Initiative has gained national recognition for compiling and presenting up-to-date information about the criminal justice system that empowers policymakers, journalists, advocates, and the general public to participate in the justice reform movement. The Department of Justice’s National Institute of Corrections, for example, calls one report “required reading for those people striving to reform the correctional system.” Frequently cited in traditional media as a reliable and accessible source on a number of incarceration issues, the Prison Policy Initiative also has an influential social media presence and demonstrated success in guiding and informing public discourse on incarceration policy. You can find a full list of the Prison Policy Initiative’s most prominent successes at prisonpolicy.org/about.html.

-30-


The study provides the first estimates of how prisons and jails led to more coronavirus infections, both inside and outside prisons.

December 15, 2020

Over half a million COVID-19 cases this summer were directly linked to mass incarceration, a new report from the Prison Policy Initiative and Professor Gregory Hooks shows. The study provides the first estimates of how prisons and jails — which are “super spreaders” of the virus — added to COVID-19 caseloads on the county, state, and national levels, including infections of people both inside and outside prisons.

“Our findings leave no doubt that locking up millions of people in this country in close quarters has led to mass sickness and death in 2020, both in and outside of prisons,” said Hooks. “This huge growth in COVID-19 cases isn’t the fault of incarcerated people; it’s the fault of tough-on-crime politicians who insist that mass incarceration is necessary to keep us safe.”

In the study, titled Mass Incarceration, COVID-19, and Community Spread, Hooks compared the population density of incarcerated people in U.S. counties to the growth in COVID-19 cases in those counties over the summer of 2020. To get a more direct measure of community spread across county lines, he also measured the impact on county caseloads from prison and jail populations held in nearby counties located within the same multi-county economic areas. The findings include:

  • At the county level: Over the summer of 2020, large prisons and jail populations within nonmetro counties (i.e. rural areas or those with small cities) directly contributed to higher COVID-19 caseloads in those counties.
  • At the regional level: COVID-19 caseloads grew much more quickly over the summer among counties in greater economic areas containing large prisons and jails.
  • At the national level: Mass incarceration led to more than half a million additional COVID-19 cases nationwide – or about 1 in 8 of all new cases – over the summer, including cases both inside and outside correctional facilities.

The report, written to be accessible to a general audience, includes graphics illustrating the major findings, as well as several tables listing the number of COVID-19 cases attributable to mass incarceration in the most heavily impacted states and economic areas. Additional appendix tables provide estimates of additional cases linked to incarceration for every county, economic area, and state in the U.S.

Preview of table showing the impact of mass incarceration on covid caseloads in 25 states.

As the report explains, prisons and jails offer ideal conditions for the transmission of the coronavirus and have had the largest COVID-19 outbreaks in the U.S. on most days in 2020. A team of epidemiologists predicted in April that mass incarceration would lead to hundreds of thousands of additional cases in the U.S. In June, the Prison Policy Initiative released a report with the ACLU showing that states were failing at the one effort likely to prevent such a tragedy: the safe reduction of prison and jail populations. As of mid-November, the Prison Policy Initiative has shown, prison and jail populations are still dangerously high.

“Now that we have the first national numbers showing how prisons and jails sped up the spread of COVID-19, lawmakers need to take action to depopulate these facilities, or we will see even more preventable cases and deaths linked to the conditions in prisons and jails,” said Prison Policy Initiative Research Director Wendy Sawyer, co-author of Mass Incarceration, COVID-19, and Community Spread. “Even though the COVID-19 vaccine is rolling out, it will be months before the virus stops cycling through correctional facilities, and the action states have taken so far has not been enough to slow it down. So far, we’ve seen that too many lawmakers don’t care enough about people in prison to take action on their behalf, but our findings show that failing to reduce prison populations during the pandemic has led to more people outside prison getting sick as well.”

The full report is available at https://www.prisonpolicy.org/reports/covidspread.html.


Stay Informed


Get the latest updates:


Share on 𝕏 Donate