March 19, 2025: Join Prison Policy Initiative’s Advocacy Department at 1 PM EST on Wednesday, March 19, 2025, for a webinar about understanding recidivism. We will cover strategies from our recidivism toolkit, including an overview of recidivism statistics and what they really mean, how to combat the “Willie Horton” effect, and ways that advocates can transform the narrative around reentry to make it less focused on negative outcomes and more focused on the ways that returning citizens contribute to their communities.
Yesterday, the Prison Policy Initiative filed comments before the California Public Utility Commission, calling for it to reduce the cost of calling home from California prisons and jails. Our comments included a comprehensive survey of the phone rates in each county.
In 2015, the Federal Communications Commission capped the cost of interstate calls at 21¢ per minute and is currently accepting comments on a proposal to lower that cap further still. However, FCC rate caps only apply to calls that cross states lines. But most calls do not cross state lines and those calls can cost far more — up to 90¢ per minute. For now, it is up to individual states to set rate caps for calls that stay within a state, so the California Public Utility Commission announced on October 19 that it was requesting comments on whether and how it should begin to regulate the industry.
Our comments review the cost of in-state calls from California facilities, as well as the too-high cost of video calls from California facilities. Our comments also addressed two other harmful practices: the prevalence of vendors bundling the phone and video services together into one complicated exploitative contract; and evidence showing that some vendors are charging more than the maximum $3 deposit fees authorized by the Federal Communications Commission.
The Utilities Commission will be accepting reply comments on November 19 and holding a pre-hearing conference on December 10. The Utilities Commission expects to have a proposed decision in the spring or summer of 2021. All of the documents filed in this rulemaking are available in Docket 20-10-002.
After skyrocketing for decades, overall incarceration rates have finally been on a slow decline since 2008. But a closer look at the data reveals a major exception: women. From 2009 to 2018, the number of women in city and county jails increased by 23% — a rise that effectively cancelled out more than 40% of the simultaneous 7.5% decrease in the men’s jail population. Meanwhile, reductions in state and federal prison populations have mostly affected men.
Women make up about 10% of people in jails and prisons. This means that patterns unique to women’s incarceration are easily obscured when we focus exclusively on the larger, overall incarcerated population. And when we overlook incarcerated women as a unique group, we also fail to address the additional challenges they face — including different health care needs and a greater likelihood of being a primary caretaker of young children — that make their growing numbers all the more alarming.
Since public health research shows that women are also affected in unique ways by the opioid crisis, we decided to see whether drug enforcement trends and substance abuse could be contributing to the rising number of women behind bars.
Increased drug arrests for women
Over the past 35 years, total arrests have risen 25% for women, while decreasing 33% for men. The increase among women is largely driven by drugs: During that period, drug related arrests increased nearly 216% for women, compared to 48% for men.1
Changes in policing in the 1990s contributed to this rise. The shift toward “broken windows” policing — or arresting people for minor offenses to supposedly prevent major crime — resulted in increased arrests for both men and women. But these policies particularly affected women, who are more likely to be involved in relatively minor drug crimes like simple possession than higher-level drug offenses.
More than a quarter of women in jail are held for drug crimes, which holds true for both convicted and unconvicted women. (Another 32 percent are held for property offenses, which are often linked to drug dependence and abuse.) In state prisons as well, the share of women incarcerated for drug and property crimes is greater than for their male counterparts.2
Where are the increases in women’s incarceration happening?
We looked to see if the increase in women’s incarceration was driven by rising arrests in rural areas, where the opioid crisis has hit particularly hard. But we found that women’s drug arrests were actually up in all county types over the last decade (by 25% in rural, 23% in urban, and 26% in suburban counties).
We also checked to see if there was a significant change in white women’s incarceration, since the current3 opioid epidemic is widely viewed as a white issue. Here we did find a relevant trend: Although prison and jail incarceration rates remain higher for Black and Hispanic women than for white women, incarceration is particularly on the rise among white women. From 2010 to 2019, overall prison incarceration rates for white women increased by 2% — while simultaneously decreasing for white men, Black men, Hispanic men, Black women, and Hispanic women. When we look back a decade further, which captures the beginning of the prescription drug crisis, the gender disparity in growth was even greater: Incarceration rates increased 38% for white women and 28% for Hispanic women from 2000 to 2010, compared to 2% and 3% for white and Hispanic men, respectively.
We also found that growth in women’s incarceration is primarily happening at the jail level. Unlike incarcerated men, incarcerated women are more likely to be in county or city jails than in state or federal prison. Most of these jailed women (60%) have not been convicted of a crime and are being held pretrial, often because they cannot afford bail. This isn’t surprising when you consider that most women held on bond have incomes that fall below the poverty line.
Trends in addiction among women
Knowing that drug arrests are on the rise, we looked to see if addiction is increasing among women, particularly opioid abuse. We found that although women and men are equally likely to develop a substance use disorder, 57% of those misusing opioids are women. The health toll is enormous: Women entered emergency rooms due to painkiller misuse an average of once every three minutes in 2010. Women’s rising opioid use is also reflected in an almost 600% increase in opioid overdose deaths from 1999 to 2016, compared to a 312% increase for men over the same time frame.
Researchers find that women may be more likely to receive opioid prescriptions due to a variety of factors: Women are more likely to seek out health care, go to the doctor regularly, and report experiencing pain, including chronic pain. Health care providers are also more likely to miss signs of addiction in women. (Disparate access to health care may also contribute to the rise in the incarceration of white women specifically. White people, who have higher rates of access to health insurance and physicians, were more likely to become addicted to prescription drugs like OxyContin than Black and Hispanic people.)
Drug dependence is also more pronounced among incarcerated women than incarcerated men. The most recent data available show that in 2009, around 70% of women serving sentences in prisons and jails struggled with drug abuse and dependence.4 And from 2004 to 2009, drug abuse and dependence among women in state prisons grew at twice the rate of men.
Additional challenges for incarcerated women
The growing number of incarcerated women face unique challenges that prisons and jails aren’t equipped to address. Incarcerated women are more likely to have a history of abuse, trauma, and mental health problems than incarcerated men.5 One-third of women in jails, for example, report experiencing serious psychological distress in the past 30 days. Women may also have additional health considerations, including pregnancy and reproductive health concerns.
Incarceration also has devastating effects on the families of incarcerated women. The majority of women in prisons and jails are mothers to minor children, and most incarcerated mothers were their children’s primary caretaker before their incarceration. The trauma of having a parent incarcerated leaves lasting negative impacts on children, and parental incarceration can cause financial instability for families.
For the sake of incarcerated women and their families, more needs to be done to understand the continued rise in women’s incarceration — and to make sure reforms impact women as well as men.
Footnotes
This data – and the data in the following graph – comes from the “Arrestee Sex” table from the FBI Crime Data Explorer. A previous version of this briefing stated total arrests had risen 15% for women, while decreasing 40% for men. The previous version of the following graph stated that drug related arrests increased nearly 190% for women and 34% for men. These percentages were based on more limited data presented in the FBI Crime Data Explorer tables entitled “Male Arrests By Age” and “Female Arrests By Age.” ↩
According to the BJS’ Prisoners Series reports from 2010 to 2019, the percentage of women in state prisons held on drug offenses remained at around 25% from 2009 to 2018, while an average of 27% were held for property offenses. Over the same time period, an average of 15% of men in state prisons were held for drug offenses and 17% for property offenses. ↩
In the 1970s, Black and Latinx communities experienced a heroin epidemic that did not receive the same amount of public awareness, sympathy, or resources as the current opioid epidemic. ↩
It’s possible the percentage of people incarcerated who are drug dependent is even higher, since the most recent data are from 2009, and heroin deaths didn’t start to rise until 2010. Additionally, the data exclude people detained in jails who are not convicted — which is about 75% of all people in jails. ↩
Across the country, local governments are building more jail space rather than working to reduce incarceration. New data shows that this trend is especially visible on tribal lands.
New data from the Bureau of Justice Statistics shows that the number of jails in Indian country has risen rapidly in recent years, from 68 jails in 2000 to 84 in 2018 (an increase of almost 24%). The number of people in Indian country jails has also grown — by over 1,000 people, or about 60% — even though the total number of people living in these areas has hardly changed.1
The rapid expansion of jail space in Indian country — that is, on tribal lands — holds with a recent nationwide trend. Jail populations have skyrocketed over the past three decades, leading first to overcrowding, and then to sheriffs announcing that they need to build more jails to alleviate overcrowding. But as we’ve previously discussed, while new jails might make existing jails less crowded in the short term, they can enable more incarceration in the long term. And in Indian country, it appears that they have.
As of 2018, 35% of Indian country jails are still holding more people than they were designed for. Compare this number to the 34% of Indian country jails that were above capacity in 2013: The share of overcrowded jails has actually increased slightly over the last several years.2 Only 55 jails in Indian country have populations consistently below their maximum capacity. As the number of jail beds has grown, so has the number of people incarcerated:
Building new jails in Indian country — as in the U.S. in general — enables the criminal justice system to lock up more people for longer periods of time. Most people in jails are being held pretrial; in other words, they are still legally innocent. Indeed, the share of people held pretrial in Indian country jails increased by 20 percentage points (an 80% increase) from 1999 to 2018, and the average length of stay in Indian country jails has doubled since 2002. (At the same time, the share of local jail populations outside of Indian country that are held pretrial has increased by 23% and the average length of stay has stretched by 33%.)
Counties can safely reduce pretrial detention by passing common-sense laws such as money bail reform. On the other hand, allowing pretrial detention to rise by building more jails means that more poor people are separated from their homes, families, and jobs before trial, and subjected to the dangerous conditions of incarceration.
Another startling finding from the report is that for 16% of people in Indian country jails, the most serious charge on which they are held is “public intoxication.” Only about 1.5% of people in U.S. jails in general are held on charges of drunkenness,3 so why is it so much more common in Indian country? Recent studies suggest that the frequency of alcohol consumption among Native Americans is not significantly higher than that of white people or the general population, contrary to stereotypes. But Indian country jails are locking up more people for public intoxication than they do for domestic violence, assault, sexual assault, burglary, larceny, drug offenses, and driving under the influence.
The answer likely has to do with local governments using police and jails to “fix” the problem of people being intoxicated in public, rather than expanding health care and housing to help them get their lives back on track. During the last three decades of jail expansion, jails — particularly in areas where social services are poorly funded — have frequently been used to house people with substance use disorders, including alcohol use, despite the fact that jails are unable to provide effective medical and mental health care to incarcerated people.
There are severe consequences to relying on jails to solve or hide social problems. We know that incarceration can be harmful to individuals and communities, but in Indian country, the effects are even more pronounced:
Health: Native people are more likely to suffer from chronic illnesses like liver disease, diabetes, and heart disease. Given that jails are not equipped to care for people with long-term illnesses, and that jails themselves are often dangerous environments (with poor food, sanitation, and temperature regulation), the chance that a Native person will die from their illness while incarcerated is serious.4
Unemployment: The unemployment rate of Native people in the U.S. is 2.7 percentage points higher than that of the general U.S. population. Incarceration — even without a conviction — hinders individuals’ ability to maintain or find employment, compounding the risk of unemployment among Native people.
Poverty: Native communities are some of the poorest in the U.S.: 1 in 3 Native Americans lives in poverty, and Native people have a poverty rate more than double that of the general population. And incarceration, as we’ve previously reported, only makes people poorer (by keeping them out of the workforce and saddling them with debts).
The recent jail-building boom in Indian country — and nationwide — reflects an unfortunate preference for using police and incarceration to solve problems that stem from inequality. As we explained in our 2019 report Does our county really need a bigger jail?, the right response to a burgeoning jail population is not to build more jail beds, but to reform local criminal justice systems and guarantee people the basic resources (including housing, healthcare, and employment) that they need to succeed.
Footnotes
In 2000, there were 944,000 American Indian or Alaskan Native people living in Indian country, according to the U.S. Census. In 2016-2018, there were 939,000, according to the U.S. Bureau of Labor Statistics. ↩
These calculations are based on the number of people held on the days in June 2018 and June 2013, respectively, on which the custody population of each facility was the largest, referred to as the “peak population.” ↩
This percentage is calculated from data used for our report Mass Incarceration: The Whole Pie 2020. 7,000 people are detained pretrial in jail on charges of “drunkenness/morals” (i.e. that is the most serious charge on which they are being held) and 4,000 are serving a sentence in jail for that same offense. Those 11,000 people make up only 1.5% of all 746,000 people in jails. ↩
Given that the death rate for American Indian and Alaska Native people is already 1.3 times higher than the general U.S. population, it is safe to assume that the rate for American Indian and Alaska Native people in jail is even higher than that of non-Native people in jails. ↩
Last week, the Bureau of Justice Statistics (BJS) released Prisoners in 2019, an annual report that breaks down the number of people incarcerated in state and federal prisons. Along with the report, BJS released a press release that paints a deceptively rosy picture of mass incarceration in the United States, which has been parroted by numerousmediaoutlets.
The press release boasts that the United States’ incarceration rate (419 per 100,000 people) is at its lowest since 1995, and that Black Americans are incarcerated at the lowest rate in 30 years. But this framing misses the bigger picture: 1.4 million Americans, who are disproportionately Black, are still incarcerated in state and federal prisons — meaning that the prison population is still five times larger than it was in 1975, before the “war on crime” really took hold and the number of people under correctional control exploded.1 Moreover, the slow pace of decarceration, especially for Black people and women, means we are looking at decades more of racially disparate mass incarceration in the United States unless lawmakers are willing to make much bolder changes.
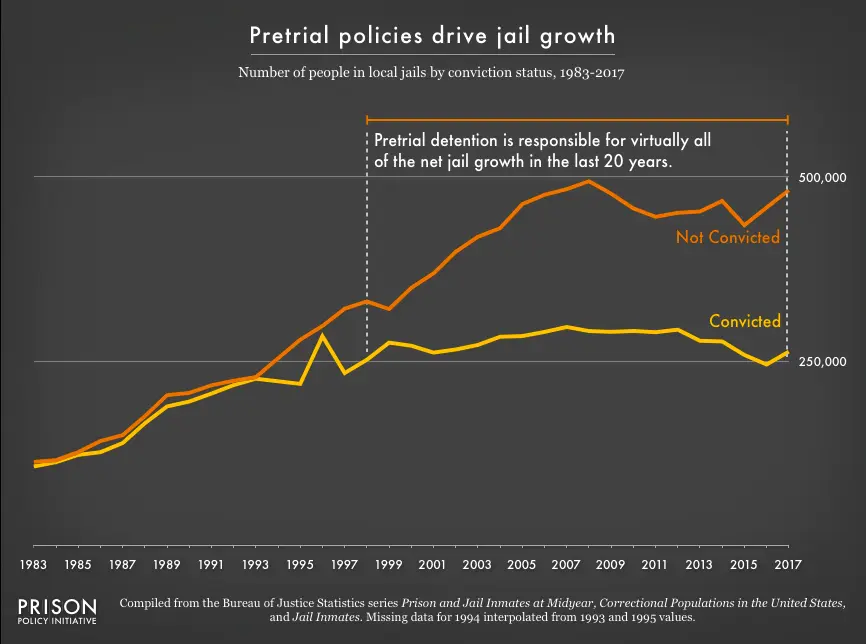
If knowing the historical context is helpful, so is understanding that incarceration goes beyond federal and state prisons. 738,000 people, disproportionately Black, are locked up in local jails as of 2018. That year (the most recent for which BJS has published jail data), there were 4.7 times as many people incarcerated in local jails as there were in 1978. This increase is largely due to the rise in pretrial detention — the jailing of people who are still awaiting trial and haven’t been found guilty of a crime. (The newly-released prison data also obscures the fact that in some places, people who would have been held by state prisons in 1995 are now held by local jails, most notably in California, where this “realignment” was enacted in an effort to reduce prison overcrowding. There and in other states, changes to sentencing structures have shifted people out of prisons but into jails.)
Not only is our state and federal prison population still massive, the data in the report reveals that our pace of decarceration has been stubbornly slow. Recent criminal justice reforms have not been nearly enough to counteract the massive growth of our prison populations over the past forty years. At the current pace of decarceration:
It will be 2044 when the federal prison population returns to pre-mass incarceration levels — 24 years from now.
It will be 2088 when state prison populations return to pre-mass incarceration levels — 68 years from now.
It will take until 2039 for the Black incarceration rate to equal the 2019 white incarceration rate—19 years from now.
And it will be 2199 when the women’s prison population returns to pre-mass incarceration levels — 179 years from now.
Troublingly, the report shows that, at least in the year before the COVID-19 pandemic, some states were moving backwards. From 2018 to 2019, Indiana’s prison population increased by 1.1%, Alaska’s grew by 2.2%, Georgia’s rose 2.2%, Nebraska’s increased by 3.5%, North Dakota and Alabama both saw a 5.5% increase, and most disturbingly, Idaho’s prison population grew by 8.9%. Even worse, almost all of these states have prison systems that are already overcrowded, or close to their maximum capacity. Nebraska and Idaho’s prisons, for example, are holding 115% and 110%, respectively, of their highest capacity. (During the pandemic, at least some of these states have reduced their prison populations more significantly, but it remains to be seen whether these reductions will last.)
The federal prison system’s population is declining at a faster rate than state prisons, but the report shows that reforms are not going far enough. Nonviolent drug offenses are still a defining characteristic of our federal prison system. In 2019, 46% of people locked up in federal prisons were serving time for a drug offense, while only 8% were serving time for a violent offense.
The report also boasts that the Black incarceration rate is at its lowest since 1989. While Black Americans certainly are incarcerated at a lower rate than they have been at other points in U.S. history, it’s important to put these numbers in perspective. Black Americans are still incarcerated in state and federal prisons at five times the rate of white Americans. 1.1% of all Black Americans are incarcerated, compared to 0.2% of white Americans. The numbers are even more disturbing when we focus in on Black men. 1 in 50 Black men are incarcerated, including over 1 in 25 Black men between 25 and 44 years old.
Finally, the report reveals that the women’s prison population is declining at less than half the rate of the men’s population. Between 2009 and 2019, the men’s prison population declined by 1.2% per year, while the women’s population has declined by 0.5%, or 550 people per year. This is despite the fact that women’s state prison populations grew 834% over nearly 40 years — more than double the pace of the growth among men.
Prisoners in 2019 underscores the need for bold criminal justice reforms that dramatically reduce our prison populations and eliminate the pervasive racial disparities in our criminal justice system. And as we have noted before, states must pay special attention to women’s incarceration. Criminal justice reforms are even more urgent as COVID-19 sweeps through prisons and jails across the country, putting millions of lives at risk.
Sources and methodology
The late 1970s is an especially useful point of reference because it is right before the “war on crime” really took hold-incarceration rates had been relatively flat for decades and the number of people under correctional control had not yet exploded. In order to determine our baselines we used incarceration rates to ensure that 1975 was representative of historical trends. We used 1975 as our starting point for the prison population comparisons and projections.
The data for our state and federal prison projections came from the Bureau of Justice Statistics reports Prisoners in 2019 and Historical Statistics on Prisoners in State and Federal Institutions, Yearend 1925-86. For the federal prison population, we used 1975 as our baseline (24,131 people) and 2012 (197,050) as our peak value with an average yearly decline since the peak (6,100/year) to arrive at our projection of 2044. And for the population held in state prisons, we used 1975 as our baseline (216,462) and 2009 (1,365,688) as our peak value with an average yearly decline since the peak (15,168/year) to arrive at our projection of 2088.
For our racial disparity projection, we relied on data in Table 5 of Prisoners in 2019. We used the current incarceration rate for white individuals (214) as our baseline, and focused on the change in the incarceration rate for Black individuals between 2009 (the year prison populations peaked) and 2019, which declined by an average of 44.8 people per 100,000 per year. It would therefore take over 19 years for the Black incarceration rate to reach the 2019 white incarceration rate.
Finally, for women’s incarceration, we used 1975 as a baseline (with 8,675 women in state and federal prisons), and 2009 (113,485 women) as the peak with an average decline of 553 women per year to arrive at our projection of 2199.
Footnotes
In 1975, there were 216,462 people incarcerated in state prisons, and 24,131 people incarcerated in federal prisons for a combined population of 240,593. In 2019, there were 1,430,805 million people incarcerated in state and federal prisons. ↩
Prisons and jails are increasingly turning to electronic law libraries, moving from traditional book collections to databases accessed via shared kiosks or tablets. As of 2018, 88% of states have transitioned to electronic-only legal research tools. And in 2020, with a pandemic making in-person gatherings risky, even more prisons and jails may be moving to make services like law libraries digital.
These legal resources are essential for people behind bars, who have a constitutional right to access the courts, which includes the right to assistance in preparing and presenting a valid legal claim.1 When prisons provide this assistance in the form of an electronic law library, it’s important to understand how and why these systems are put in place.
In particular, there’s a world of difference between a prison system that designs a digital library with the needs of incarcerated people in mind, compared to one that digitizes its library primarily to cut the costs of running a physical library. To illustrate this difference, consider the two markedly different approaches that Oregon and South Dakota took when implementing an electronic law library system. While neither state’s program is perfect, both provide valuable lessons in the importance of system design.
Oregon
Oregon’s new program is unique because of the way it was designed. It originated with State Law Librarian Cathryn Bowie, who noticed a substantial number of requests for materials that already existed but which were inaccessible to those in the state prison system. While the resulting online system is expected to save the state money over time, it was designed with usability, not budget cutting, as the primary focus. Oregon’s system is an online legal research system provided by a vendor called Fastcase, with external links disabled. Oregon’s system for legal research has several key features:
Planning process. Planning for the Oregon project started with librarian Bowie visiting every prison in the state and asking incarcerated people about their research needs. Although the content is provided by a vendor (Fastcase), the system was designed in-house, as a collaboration between the state law library and the Department of Corrections.
Cross-agency. The research platform is available not only to adults in the state prison system, but also to patients in the Oregon State Hospital and juveniles confined in the Oregon Youth Authority.
Expansion plans. According to Bowie, the project’s designers are not resting on their laurels. Having established the basic functionality and security of the research platform, the designers are evaluating future enhancements (again, driven by user needs). For example, the research platform is now available on desktop computers in facility libraries, but project managers are working on ways to make the resource more readily available to people in segregation or who otherwise have difficulty accessing the library. Other features that could be in the works in the future include educational programs, an expanded catalogue of publications, and electronic court filing capabilities.
Ongoing training. Bowie continues to tour the state, training incarcerated people on the new electronic legal research system. Unlike South Dakota where training is conducted by a marketing employee of the contractor, Oregon’s training is conducted by the person who is in charge of the program: thus user feedback and suggestions can go straight to the program manager, without having to filter through layers of corporate bureaucracy.
No system is perfect, and surely, Oregon’s law library system has shortcomings. Still, the very fact that it is designed and managed with the specific needs of incarcerated users in mind is a step in the right direction.
South Dakota
On the other hand, South Dakota’s law library system design is largely a result of cost cutting efforts by prison administrators. Prior to 2017, South Dakota provided legal assistance to people in its state prison system via contract attorneys and paralegals who would visit facilities and provide one-on-one assistance to people who needed help. However, in October 2017, the state eliminated this system and replaced it with a computer research program provided by Lexis-Nexis. Users are expected to access this database via computer tablets issued by communications company Global Tel*Link (“GTL”).
The switch saved the state over $80,000 on its regular contracting, not to mention savings on other costs, like printed law books.2 Yet, the cost savings is only part of the story:
Technical failures. When the tablets were rolled out, many users reported persistent connection problems that prevented them from actually doing legal research. Managers eventually concluded that the system’s wireless signals could not travel through the thick reinforced concrete that was used in many facilities, something that apparently was not tested prior to the rollout of the new system.
Economic unfairness. Although people in South Dakota receive a tablet for free, woe be to those who experience malfunctions. GTL’s corporate representative did not even know if there was technical assistance for people whose tablets fail through no fault of their own. However, if an “investigation” determines that the user is responsible for damage, then they must pay $199 for a replacement. GTL buys the tablets for $80 each.
Technology instead of help. The Lexis app that runs on the GTL tablets is the same software that legal professionals use (Lexis Advance), with external links disabled. On the one hand, this is helpful since plenty of training materials for Lexis Advance already exist. On the other hand, it’s a vivid illustration of the folly of not providing regular in-person assistance to incarcerated people who need legal help. Law schools and law firms spend considerable resources training lawyers (or soon-to-be lawyers) how to navigate Lexis’s dense collection of information. It is willful indifference to simply give an app to a population of non-lawyers with below-average levels of formal education and unfamiliarity with technology, and expect them to perform legal research. Even GTL’s corporate representative admitted that the tablets are used by “individuals who, in many instances…have no familiarity with tablet technology.” Lexis did provide some on-site training when the program first started, but now only offers live training upon the DOC’s request, via a Missouri-based employee who is responsible for numerous states. It’s unclear whether the DOC regularly schedules such trainings, but it is clear that user education is an afterthought.
Lack of detailed planning. Incarcerated people sued South Dakota in 1998, alleging constitutional violations of their right to access the courts. When the state settled those lawsuits, it agreed to maintain specified legal resources at all state prisons. It would be logical that the new computerized research system would be designed to honor the state’s obligations under the settlement agreement, but Lexis-Nexis’s corporate representative testified that he was unaware of the settlement or its contents.
Conclusion
South Dakota and Oregon illustrate two radically different approaches states can take to updating their prison law libraries: Take the time to identify people’s needs, and then work collaboratively to continue to train users and modify the systems as necessary; or offload the burden of providing a law library onto a private company, who in turn throws a digital product at incarcerated people and wishes them the best. Unfortunately, by now, many other prison systems have likely taken South Dakota’s path. But with incarcerated people’s access to the courts on the line, states need to focus not on cost-cutting, but on usability.
A Note on Methodology
This piece was written using a combination of sources. The information on Oregon’s law library largely came from an interview on the radio show Think Out Loud with librarian Bowie and an interview by the author. For South Dakota, we drew on two depositions from a 2018 class action case, Brakeall v. Kaemingk. The information used in this briefing can be found in the deposition of Brian Peters at pages 20-35, and the deposition of Anders Ganten at pages 21-34.
In 2017, the South Dakota legal aid contract cost $137,400. Other costs, like paper law books and fees for alternate lawyers when the on-site attorney had a conflict, added up to over $276,000 in 2017. The Lexis-Nexis research program cost only $54,720 in the first year. ↩
Using D.C. as a case study, we explain how much non-criminal – and often drug related – “technical” violations of probation and parole contribute to unnecessary jail incarceration.
Parole and probation violations are among the main drivers of excessive incarceration in the U.S., but are often overlooked policy targets for reducing prison and jail populations. Nationally, 45% of annual prison admissions are due to supervision violations, and 25% are the result of “technical violations” — noncompliant but non-criminal behaviors, like missing meetings with a parole officer. The sheer number of people held in jail for mere violations of supervision exemplifies the gross overuse and misuse of incarceration in the U.S.
Despite their impact on local jail and state prison populations, technical violations are not well understood, often appearing in the data simply as “violations” without any description of the underlying behavior. However, Washington, D.C. stands out by publishing a wealth of local jail data as well as contextual data from federal agencies like the Court Services and Offender Supervision Agency (CSOSA), which offers a fuller story of what happens to people on supervision.
Given this abundance of data, we use D.C. as an illustrative example to explore excessive jail detention for technical violations, including what behaviors lead to violations, the extraordinary lengths of time people can be held for violations, and important demographic information showing that people on supervision face serious employment and housing barriers – which are only exacerbated when violations lead to re-incarceration. Following our analysis of D.C. technical violations, we discuss the problematic legal process underlying these violations.
In the nation’s capital, the scope of the problem is conspicuous. The Washington, D.C. Department of Corrections estimates that 14.3% of all men and 8.5% of all women housed in the system are held as a result of a parole violation.1
How D.C.’s supervision system sets people up for revocation
Burdensome conditions of release
With so many requirements, it’s easy to “fail” supervision.
Leaving the “judicial district” without permission
Not working regularly
Not attending training, school, or drug treatment
Not notifying their CSO of a change of address or employment
Going to places where illegal substances are sold, used, stored, or administered
Associating others who are “engaged in criminal activity” or have felony convictions
Not notifying, within 2 days, their CSO of a new arrest or mere questioning by police
Acting as an informant or special agent for law enforcement without permission
Not adhering to any other general or special conditions, like curfew or GPS monitoring
Not submitting a sample for drug testing
Not paying fees that are a condition of release
When people serving a sentence from D.C. Superior Court are released from jail or prison, many remain under supervision of some form – either supervised release or parole. Each person under supervision must comply with certain conditions, which are monitored by a Community Supervision Officer (CSO). The same is true of those sentenced by a court to probation, another form of supervision, instead of a period of incarceration. The Robina Institute estimates that people on probation must comply with 18 to 20 requirements a day; the list of requirements in D.C. illustrates how easy it can be to “violate” these many conditions (see sidebar).
Enforcement of the often numerous and onerous conditions is left to CSO discretion. When someone under supervision does not meet one or more of their requirements, the CSO either decides to apply “graduated sanctions” – like more frequent drug testing, more frequent reporting, or curfew – or files an Alleged Violation Report (AVR). The AVR is the document that initiates proceedings against a person under supervision, which, if a warrant is issued, may result in a revocation hearing and ultimately, incarceration.
The system of supervision leads to inflated jails
In D.C., the second most common “most serious offense” for men in jail is a parole violation, just behind assault and ahead of weapons violations, drug offenses, property crime, burglary and robbery, and other violations of law. Among women, parole violations are the third most common “most serious offense.”2 The D.C. Department of Corrections (DOC) reported that, as of April 2020, 8.5% of women and 14.3% of men in jails were held on charges that included a parole violation or had a “Parole Violator” status.3
For context, we previously found that in both New York and Texas, parole violations made up just over 8% of those in jails statewide. In comparison to those states, D.C.’s jails hold a larger proportion of people on parole violations. However, when compared to the share of people held for supervision violations in other large cities like Philadelphia (58%), New York City (27%), and New Orleans (22%), D.C.’s incarceration for violations (about 14%) appears consistent with – or even more modest than – other cities’.
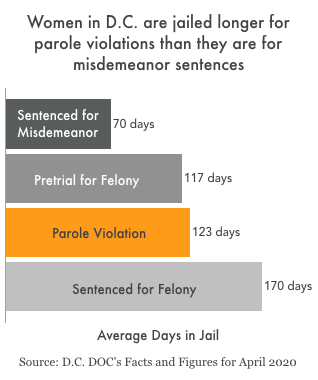
In more concrete terms, those percentages mean that roughly 250 out of nearly 1,800 people in D.C.’s jails4 are being held because they violated parole or are awaiting a revocation hearing. It is worth noting that, while the Court Services and Offender Supervision Agency (CSOSA) officially reports that Alleged Violation Reports for technical violations usually do not result in revocation to incarceration, just because someone isn’t officially revoked doesn’t mean they won’t spend a long time in jail awaiting a hearing for that decision. For people in jail whose most serious (alleged) offense is a parole violation, the average stay is nearly 4 months.
Four months in jail is nothing to scoff at. And yet, on average, a woman in D.C. Jail on a parole violation is confined longer than one awaiting a felony trial and almost four times as long as those awaiting trial for misdemeanors. Even more egregious, jail time for women’s parole violations, on average, outlast even full sentences for misdemeanor convictions. Such extended periods of confinement are concerning because even much shorter periods of incarceration can result in severeconsequences like housing and job loss, on top of the extreme loss of liberty, privacy, and self-determination inherent in incarceration.
Most violations are infractions for low level – and frequently non-criminal – offenses
Frequently, people who are rearrested while on supervision are not arrested for a new crime, but are scooped up by the criminal legal system for entirely non-criminal behavior. In D.C., 30% of people who are rearrested while on supervision are arrested merely for violation of a condition of release.5
In contrast, less than 5% of rearrests were for “violent” offenses.
The large number of arrests for supervision violations is particularly frustrating when we look more closely at what these arrests are for. While the D.C. jail data does not include a breakdown of the underlying offenses for parole violations, data from the Court Services and Offender Supervision Agency (CSOSA) about Alleged Violation Reports (AVRs) helps fill this gap. While not all AVRs lead to arrest and jail time, technical violations that land people in the D.C. Jail typically start with an AVR.
In 2019, just under half of the total population on supervision (7,217 out of 14,830 people) had violations that a Community Supervision Officer (CSO) deemed serious enough to warrant an AVR, initiating revocation proceedings.6 Of those AVRs, about 60% were for new arrests, 20% were for missing supervision appointments, and 20% were for other technical violations – many likely drug related, considering the overwhelming share of all technical violations related to drug tests.
CSOSA provides data on all technical violations – not just those that result in an AVR – and overall, drug related violations account for far more technical violations than any other offense type.7 In 2019, D.C. reported 96,528 total technical violations; over 90% (87,424) were drug related. While drug offenses are generally perceived as low-level offenses, even the term “drug related” may overstate the severity of these violations: over half were for not submitting a specimen for testing – not for failing a test, but simply missing a test.
For those on supervision who are struggling with substance abuse, the carceral “solution” forged by the parole system is counterproductive. It rips people from tangible supports like drug treatment and counseling, opting to criminalize individuals rather than taking a public health approach. People are then sent back to jail or prison, stifling any progress towards sobriety they may have made in the community.
Of the small portion of technical violations that were not drug related, most were for relatively trivial offenses: 3.1% were for not reporting to a Community Supervision Officer (CSO), 3% were for a violation relating to electronic monitoring, and less than 1% were for not cooperating with drug treatment. 2.4% were categorized as “other non-drug violations.”
Violations and revocations undermine community supervision goals
At least in theory, supervision after incarceration is meant to successfully reintegrate people back into society. CSOSA recognizes that the beginning of supervision is particularly challenging for those new to supervision. Yet their solution is merely to “stress the importance of complying,” threatening jail time instead of offering tangible supports for people on supervision who are facing so many other barriers. For example:
Only half (52%) of those under supervision were employed. CSOSA estimated that less than two-thirds of the population under supervision was employable to begin with.8
More than 1 in 4 (29.4%) people in the supervised population do not have a high school degree or GED.
More than 1 in 10 (11.2%) people on supervision do not have stable housing.
Compounding the problem, jail time and revocations destabilize vulnerable people even further:
Those who are revoked are far less likely to be employed, even if they were employable in the first place: only 17.4% of those revoked who are employable have work.
Almost 45% of those who are revoked do not have a high school level degree.
People who are revoked are more than twice as likely as those who were not reincarcerated to have unstable housing.
Even the system used to determine whether a violation occurred is seriously flawed
Incarceration for supervision violations is especially concerning because revocation hearings are much less formal than criminal proceedings and come with many fewer protections, despite the fact that periods of incarceration after revocation can exceed full sentences handed out by a court. For instance, while the criminal standard for conviction requires proof “beyond a reasonable doubt,” a finding of revocation needs only to be based on a “preponderance of the evidence.”9 Hearing examiners in revocation hearings can also consider evidence that would be inadmissible or might not reach the standards of credibility required in a criminal case.10 And there is no right to a jury despite the fact that most recommended sentences for revocations are over 6 months.11 For technical violations alone, sanctions can include up to 16 months of incarceration or extended supervision.
Even the guideline categories that recommend new sentences for different violations are problematic. The range of recommended periods of incarceration is based off of a “Salient Factor Score.” However, these scores are almost entirely based on a person’s past criminal record – a measure which people cannot change and only ever increases but never decreases. Because the score weights previous criminal records so heavily, only 0.4% of people fall into the lowest risk category and consequently the lowest recommended sentences. Compounding the problem are expedited revocation offers, which, in practice, are similar to coercive plea deals.12
The big picture
People in jail for technical violations – things that are not criminal offenses for people not under supervision – exemplify the overuse and misuse of incarceration. D.C. is just one criminal legal system among over 50 more in every state and territory. Dismantling mass incarceration is impossible without also addressing the systems that latch on to people involved in the criminal legal system and refuse to let go. To get the full picture, politicians, advocates, and scientists must take hard look at the many Americans under supervision and the ways that they are continuously churned through our massive criminal legal system. It is time to end these cycles of criminalization and find solutions that free people from the enormous reach of supervision.
Footnotes
The information in this briefing is based on the D.C. DOC’s Facts and Figures report from April 2020. The D.C. DOC put out a report with updated figures from July 2020 that shows the proportion of people held on parole violations as being lower than April. This is likely due to the COVID-19 pandemic, and thus is not necessarily representative of incarceration over time. It does, however, suggest that it is unnecessary to hold so many people in jail for parole violations. ↩
These rankings exclude men and women held by the U.S. Marshals’ Service (USMS) who are held in D.C. Jails for trials in the federal system. USMS holds account for 30% of the male population and 35% of the female population. ↩
The total number of people total who are charged with a parole violation may actually be higher, because it may not be their “most serious offense.” ↩
This estimate is based on the average daily population of the D.C. correctional system in FY 2020 and the percentages of “Parole Violators” reported in the D.C. DOC’s Facts and Figures for April 2020. More specifically, we estimate that about 240 of 1,675 men and 9 of 111 women were held at least in part on parole violations. ↩
On top of that, another 12% were arrested for “public order” offenses – things like DUIs, disorderly conduct, gambling, prostitution, traffic offenses, vending and liquor law violations, drunkenness, vagrancy, curfew, and loitering. ↩
There were 6,851 AVRs issued for those on supervised release and parole and another 366 for those on probation. The total supervised population was 14,830, meaning that just under half of the people on supervision, at some point in 2019, had an AVR submitted. ↩
There are eleven substances that the drugs tests measure, including alcohol and cannabis. Use of either substance, though it may not be illegal, may constitute a violation of release. ↩
Employability is determined by CSOSA by a job verification at the beginning of each person’s supervision period. CSOSA deems a person employable if they are not retired, disabled, suffering from a debilitating medical condition, receiving SSI, participating in a residential treatment program, participating in a residential sanctions program (i.e., incarcerated), or participating in a school or training program. ↩
Proof beyond a reasonable doubt is an exacting and high standard of proof. The jury instructions describe that it is absent of the kind of doubt that “would cause a reasonable person, after careful and thoughtful reflection, to hesitate to act in the graver or more important matters in life.” On the other hand, a preponderance of the evidence requires only that the fact is more likely true than not. ↩
In criminal court, judges use complex rules like the Federal Rules of Evidence to ensure that evidence used to convict a person is both reliable and credible. However, in revocation hearings, a finding of credibility or reliability is not required. Instead, hearing examiners can exclude evidence that is irrelevant or repetitious. Also, fewer constitutional protections apply, meaning that hearing examiners can review things that courts have excluded on constitutional grounds. ↩
In D.C. Superior Court, people who are charged with offenses that are punishable by at least 180 days of incarceration or a fine of $1,000 are entitled to have their cases heard by a jury. Cases that carry less than a maximum of six months’ incarceration are be heard and decided by a judge. D.C. Code S 16-705(b). ↩
These plea deals encourage people to admit guilt, even when they may be entirely innocent, in order to avoid going to a hearing or trial which might lead to even more time behind bars. ↩
Any amount of time spent in solitary confinement increases the risk of death after release from prison, including deaths by suicide, homicide, and opioid overdose.
A recently published study of people released from North Carolina prisons confirms what many have long suspected: solitary confinement1 increases the risk of premature death, even after release. Personal stories, like those of Kalief Browder’s isolation and subsequent suicide, are canaries in the coal mine. Underneath seemingly isolated events, researchers now find that solitary confinement is linked to more deaths after release from prison. These preventable deaths aren’t outliers; in the U.S., where the use of solitary confinement is widespread, an estimated 80,000 people are held in some form of isolation on any given day, and in a single year, over 10,000 people were released to the community directly from solitary.
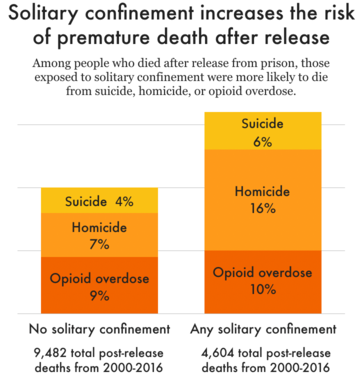
Premature deaths – by suicide, homicide, or opioid overdose – after release from prison are more likely for those that spent any amount of time (even one day) in solitary confinement than those who have never experienced solitary confinement.
The new study shows that the effects of solitary confinement go well beyond the immediate psychological consequences identified by previous research, like anxiety, depression, and hallucinations. The authors, from the University of North Carolina, Emory University, and the North Carolina Departments of Public Safety and Public Health, find that any amount of time spent in solitary confinement increases the risk of death in the first year after individuals return to the community, including deaths by suicide, homicide, and opioid overdose.
Reentry is tumultuous and challenging to begin with, and the first two weeks after release are among the most difficult. Previous research has shown that, within those first two weeks, the risk of death from drug overdose, cardiovascular disease, homicide, and suicide is elevated. A 2007 study found that the risk of death in these first two weeks can be up to 12 times higher than that of the general population. Building on that study’s findings, this new North Carolina study finds that the experience of any solitary confinement more than doubles the risk of death for people recently released from prison.
The study identifies two additional factors correlated with a heightened risk of death after release: race and the amount(length and frequency) of solitary confinement. All incarcerated people of color are more likely to die within a year of release, and the experience of solitary confinement only amplifies this racial disparity. A previous study found that, compared to their share of the total prison population, Black men and women are overrepresented in solitary confinement, exposing them disproportionately to its harms. And unsurprisingly, more frequent placements in solitary confinement—as well as longer stays2—are associated with worse outcomes across both white and nonwhite populations.
This graph is based on the Cox Propotional Hazard ratio, which represents the risk of death while accounting for variables like sex, race, age, prior incarcerations, length of incarceration, and other factors as calculated by the authors of the study. People who are confined in solitary are more likely to die of any cause, opioid overdose, homicide, and suicide than those who do not experience solitary confinement. People with more than one experience in solitary confinement are even more likely to die within the first year of release of all causes, homicide, and suicide.
This study adds to the overwhelming body of evidence that solitary confinement causes indelible harm and should be prohibited. But until that happens, the authors recommend that discharge plans and public health systems should consider time spent in solitary confinement as a health risk factor to be addressed when people are released from prisons. By considering solitary confinement in discharge plans, reentry programs and professionals could connect people to services after release from incarceration, specifically trauma-informed, community-based substance use and mental health treatment, overdose prevention and harm reduction, and wraparound care and services.
Of course, there is no need to wait until a person is released from prison to address the long-lasting harms of solitary confinement. Programs and professionals working in prisons that use solitary confinement should use this information to provide services that focus on breaking the link between solitary confinement and premature death after release. Correctional systems should not wait to mitigate harms after they have already occurred: Solitary confinement causes far more harm than good and is not a “rehabilitative” process.
Footnotes
The phrase “solitary confinement” is not used consistently. Some prisons deny that they employ it, instead opting for more administrative-sounding terms, like “Segregated Housing Units” (SHUs) and “restrictive housing.” (See this list from MuckRock for more examples.) While conditions can vary between facilities, for our purposes, “solitary confinement” refers to the practice of segregating individuals from the general population for any reason. Under solitary confinement, individuals are typically forced to remain in small, individual cells for 22 to 24 hours per day with minimal human interaction. ↩
In 2015, the United Nations revised the Standard Minimum Rules on the Treatment of Prisoners and called for an end to solitary confinement lasting longer than 14 days. Regardless, at least 25 states reported in 2017 that 3,500 people were held in solitary confinement for at least 3 years. ↩
As we noted back in May, when most Americans were getting one-time $1200 stimulus payments from the IRS, the government was quietly trying to deny making payments to incarcerated people, even though there is no such restriction in the law that created this program. Plenty of people noticed the government’s lack of a solid basis for denying the payments, and at least two lawsuits over the issue are pending in federal courts.
On September 24, 2020, a judge in California issued a ruling requiring the IRS to process stimulus payments for incarcerated people. This isn’t quite the end of the story. The judge’s ruling could be stayed or reversed on appeal, or Congress could amend the law to prohibit payments to incarcerated people.1 But for the time being, IRS is accepting mailed applications from incarcerated people through November 4 (extended recently from October 30 because of a court ruling) and online applications through November 21.
Q: How do I know if I or my loved one in prison qualifies for the stimulus check?
A: We can’t give individualized tax advice, but you might find our discussion and the links to how the CARES Act defines eligible individuals helpful. See the “Does incarceration make people ineligible for stimulus payments?” section in our original stimulus checks article (written before the Court ruled).
Q: How do I apply for my stimulus check (or apply on behalf of a loved one in prison)?
A: Please see this explainer from the Uptown People’s Law Center with instructions on how to apply.
Q: I’m confused about the application procedure (for instance, which address to put down for my loved one).
A: We’re not able to answer specific questions about the process of applying, but we keep a list of organizations in several states offering free legal assistance to incarcerated people. One of those organizations might be able to help you.
Footnotes
The Senate proposal for additional economic stimulus (S. 4318) does contain language that would prohibit stimulus payments to people who are incarcerated for every day during calendar year 2020. The newly-announced House proposal does not contain such a restriction. Neither bill has yet to receive a floor vote. ↩
The vast majority of people held in Massachusetts jails maintain the right to vote, but they are often de facto disenfranchised because of a lack of access to voting systems and voter registration.
We’ve joined a coalition of organizations across the state calling on the Secretary of the Commonwealth to secure access to the ballot for people who are eligible to vote but face barriers because they are in jail. You can read the full letter we signed on to here, which outlines in detail the specific barriers faced by people detained or serving sentences in Massachusetts jails.
This morning, the Prison Policy Initiative and the Reverend Jesse Jackson, Sr.’s Rainbow PUSH Coalition released Eligible, but Excluded,a roadmap to expanding voting access for people incarcerated in local jails who are already eligible to vote.The report explains – via a 50-state table and flowchart – that most of the 746,000 people in local jails retain the right to vote. The report then details the logistical barriers that prevent these voters from casting ballots, and strategies for bringing these barriers down.
“Thousands of people in jails across America retain the right to vote, but they are denied that right in every election,” Reverend Jackson said. “Many of these voters are being held simply because they are poor and can’t make bail. This form of voter suppression is a truly heinous form of social injustice and civic indignity. This report provides the data that will help us fight back against this injustice. And fight we will!”
The report provides an in-depth explanation of the most common issues preventing people in jail from voting, including:
Confusion about who is eligible to vote, among election officials as well as incarcerated people themselves
Registration-related barriers such as restrictive deadlines and a lack of access to personal information
Ballot-casting barriers including strict for-cause absentee voting policies
Population churn in jails, which means that some people who register to vote in jail may not be incarcerated on Election Day.
The report goes on to offer 29 strategies for advocates, state legislatures, election officials, and sheriffs to enable people in jail to exercise the franchise.
“In an era of criminal justice reform, protecting the right to vote for persons held in jail is among the most important reforms,” said Reverend Dr. S. Todd Yeary, co-author of the report. “The state-by-state analysis in this report sets the landscape for the policy fight to protect the right to vote for persons who are legally eligible to cast a ballot, but are unjustly prevented from doing so. This is our justice roadmap for issue advocacy in upcoming state legislative sessions, as well as policy changes by sheriffs, prosecutors, and governors across the country.”
March 19, 2025: Join Prison Policy Initiative’s Advocacy Department at 1 PM EST on Wednesday, March 19, 2025, for a webinar about understanding recidivism. We will cover strategies from our recidivism toolkit, including an overview of recidivism statistics and what they really mean, how to combat the “Willie Horton” effect, and ways that advocates can transform the narrative around reentry to make it less focused on negative outcomes and more focused on the ways that returning citizens contribute to their communities.


 Premature deaths – by suicide, homicide, or opioid overdose – after release from prison are more likely for those that spent any amount of time (even one day) in solitary confinement than those who have never experienced solitary confinement.


