March 19, 2025: Join Prison Policy Initiative’s Advocacy Department at 1 PM EST on Wednesday, March 19, 2025, for a webinar about understanding recidivism. We will cover strategies from our recidivism toolkit, including an overview of recidivism statistics and what they really mean, how to combat the “Willie Horton” effect, and ways that advocates can transform the narrative around reentry to make it less focused on negative outcomes and more focused on the ways that returning citizens contribute to their communities.
April 15-17, 2025: Sarah Staudt, our Director of Policy and Advocacy, will be attending the MacArthur Safety and Justice Challenge Network Meeting from April 15-17 in Chicago. Drop her a line if you’d like to meet up!
Not near you? Invite us to your city, college or organization.
Sacramento County, California’s jail confines 4,100 people on a typical day, so the selection of the sheriff should be a big deal for Sacramento residents, yet the leading campaign contributor is a company from Texas.
Dallas-based Securus apparently has a strong interest in who gets to be the Sacramento County Sheriff, so much so that the prison and jail telecommunications giant has been giving $10,000 a year to the Sheriff’s reelection fund for at least the last 3 years, as we describe in a letter sent this morning to the Federal Communications Commission.
Now what’s especially interesting about this is that Securus doesn’t currently have a relationship with Sacramento County; in fact, the county’s current phone contract is with competitor ICSolutions. We wouldn’t be surprised to see the contractor change soon, though, as new bids for the contract were due in July.
As the Federal Communications Commission prepares for a new ruling on regulating the industry, our letter addresses one of the more controversial issues: What should the FCC do about the commissions currently demanded by the facilities in exchange for awarding monopoly contracts to the prison and jail telephone companies? The demand for commissions is at the root of the dysfunction in the prison and jail telecommunications market, but we believe banning the commissions is not necessarily the solution.
We argue that the FCC can simply ensure that the rates and fees charged are reasonable and leave the companies and the facilities to fight over whether and how to share the reasonable profits that remain. (Relatedly, one also has to wonder if things like campaign contributions could possibly explain part of the discrepancy between the tiny profits that Securus tells the FCC it makes and the huge profits that Securus claims before its investors. )
In fact, ensuring that the rates are reasonable is the approach the FCC already took when they regulated inter-state calls, capping the charges for the calls and declaring that commissions were not a legitimate cost that could be used to justify higher rates.
Put simply, the FCC should ensure fair rates for families; that’s best achieved through direct regulation of rates and fees, not by trying to iron out every misaligned incentive in the market.
This interactive tool and article uses data from 15 states to model the impact of various types of reforms to state criminal justice policies. The Forecaster brilliantly makes a very important point: There is plenty of low hanging fruit left that most states can use to lower their prison populations, but making a real dent in mass incarceration is going to also require some tough policy choices.
And now, with the Forecaster, you don’t need to have a degree in statistics to see what the results of particular policy changes might be. Anybody can do it. By empowering more people to access the data, the Urban Institute has made these critical policy choices all the more accessible.
Last week, Shaila Dewan had a brilliant story in the New York Times about how probation sentences set people up to fail: Probation May Sound Light, but Punishments Can Land Hard. The article follows a woman who was arrested for drunk driving, her first offense of any kind, and whose life entered a very expensive spiral, including the loss of two jobs and having to pay almost $4,000 in fees, fines, and court costs and $2,000 to post bail. In addition, she was forced to spend 34 days in the dirty, dank, dangerous and disgraceful Baltimore jail simply because she was unable to find attendance slips from her required A.A. meetings, and she could not afford another $2,500 bail bond to get out of jail time.
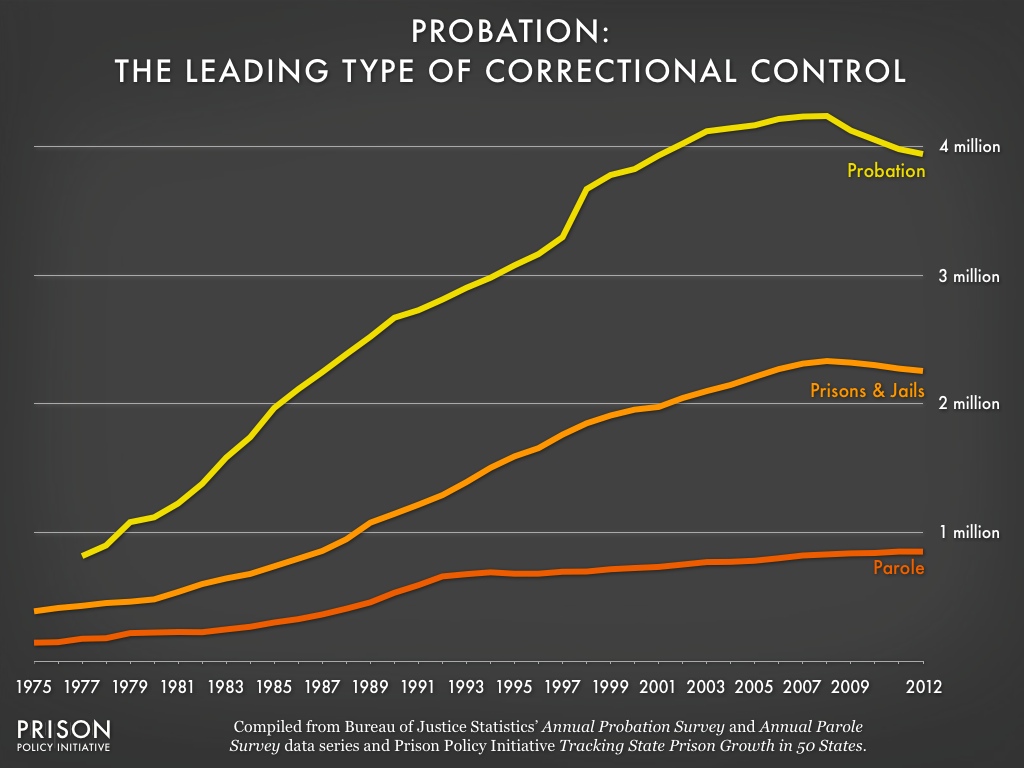
Because many people on probation fail to meet the conditions of their community supervision, probation often isn’t the alternative to incarceration it’s made out to be. The harm of probation would be important even if probation were rare; but more than half the people under correctional control are on probation.
Since the beginning of the statistics almost 40 years ago, the probation population has grown much more quickly than either the number of people on parole or the number of people in federal, state and local prisons and jails. While about 2.3 million U.S. residents were behind bars in 2012, almost 4 million residents were under probation.
As the Council of State Governments’ Justice Center has shown, Rhode Island’s probation sentences are 53% longer than the U.S. average, and it’s one of 14 states that doesn’t cap how long probation sentences can be. (Thirty-two states have limited probation sentences to no more than 5 years.) Further, the Justice Center says that they have anecdotal evidence that probation isn’t being used as an alternative because “a large portion of felonies receive split sentences” that include both prison and probation.
Last month, Rhode Island’s governor created the Justice Reinvestment Working Group in order to get to the bottom of the state’s use of probation. One answer I hope the group will uncover as they develop a path to more reasonable uses of correctional control is exactly why Rhode Island decided to leave its neighbors behind in the use of probation:
The rate of probation in Rhode Island is more than twice as high as the rate of probation in most other New England states. (Massachusetts was not included in the graph above because the state changed its reporting methods multiple times during the previous decade. However, in the most current available data, Massachusetts reported a rate of 1,033 adults on probation per 100,000 residents, less than half Rhode Island’s rate of 2,268 per 100,000 residents.)
With a growing number of presidential candidates calling for an
end to mass incarceration, there has been a flurry of discussions in the press about the role that the Executive Office can play in reversing our nation’s over-use of the criminal justice system. Since most incarcerated people are locked up in state prisons, people have been asking, what can the leader of the federal government do about mass incarceration?
While it turns out that the answer is “quite a bit,” these discussions have largely overlooked the powerful role that the federal budget plays in shaping state policy. Criminal justice policy is no exception. As Inimai Chettiar observed in the Brennan Center for Justice’s Solutions: American Leaders Speak Out on Criminal Justice:
The federal government has been one of the largest instigators of perverse incentives. For example, the 1994 Crime Bill included $9 billion to encourage states to drastically limit parole eligibility. Unsurprisingly, 20 states promptly enacted such laws, yielding a dramatic rise in incarceration. Today, the federal government continues to subsidize state and local criminal justice costs to the tune of $3.8 billion annually.
Given the federal government’s historical role in fueling mass incarceration, Chettiar points out, federal budgetmakers could switch gears to instead incentivize smarter and more measured criminal justice policymaking:
One basic, yet effective, step: The federal government should provide funds to states that cut both crime and imprisonment. California,
Texas, and other states succeeded by changing financial incentives. They
awarded additional funds to local probation departments that reduced
the number of people revoked to prison. In its first year alone, California
reduced revocations to prison by 23 percent, saving the state nearly $90
million. In one year, Texas reduced the number of people revoked to
prison by 12 percent. In both states, crime continued to drop.
To be sure, slowing and reversing the our nation’s unprecedented use of correctional control requires a multifaceted and long-term approach. But as the other 2016 candidates shape their criminal justice policy platforms, they shouldn’t underestimate the federal budget’s power to steer state justice policy in a positive direction.
By drastically slowing releases from prisons, Texas policymakers ensured that the state’s prison population would more than double in only five years in the 1990s. Decades later, Texans are still dealing with the consequences.
In May 2014, the Prison Policy Initiative created incarceration profiles for each state, and the Texas statistics were shocking. They revealed a doubling of the Texas prison population in just a few years. As a native Texan, high imprisonment rates were no surprise, but the rapid rise in imprisonment seemed almost impossible, especially compared to the nation as a whole:
Throughout the 1980s, the Texas imprisonment rate closely matched the national imprisonment rate. But between 1993 and 1998, the Texas imprisonment rate almost doubled, causing Texas’ total custody population to quickly escalate.
The imprisonment rate in Texas has been generally equal to or higher than the national imprisonment rate. This fact was no surprise because Texas has been known for its tough-on-crime mentality. But what was so special about 1993 that caused the imprisonment rate in Texas to skyrocket?
The answer lies in the underlying mechanisms that drive prison admissions and releases. As Michele Deitch, a Soros Senior Justice Fellow and Texas criminal justice expert, describes, correctional facilities are like bathtubs: people are admitted to prisons like water from the faucet and released like water from the drain. If admissions and releases are not in balance, prisons, like bathtubs, will overflow.
To test that analogy and uncover the policy change that sent Texas’ imprisonment rate soaring, I collected annual data on admissions to and releases from Texas prisons and graphed them both against the total custody population:
Beginning in 1993, the number of releases from Texas prisons fell behind the number of admissions, allowing the state’s total custody population to rise sharply for the next five years. Once release counts rose again to match admission counts, Texas’ total custody population leveled off and remained stagnant. These patterns show that admissions to and releases from prisons serve as at least one driving force behind rapidly changing prison populations.
When Texas made the choice to reduce the rate of prison releases, the state prison population more than doubled in five years, just like a running bathtub would if a stopper were placed over the drain. More recently, other policy changes have allowed the number of releases to match the number of admissions, causing the total custody population to flatten out after its massive increase.
Before 1993, admission and release counts in Texas were roughly equal, so the total prison population grew only slightly. Driven by the War on Drugs, prison admission rates increased steadily in the 1980s, but they were closely matched by prison release rates. For example, incarcerated Texans in the early 1990s only served an average of 13% of their assessed sentences behind bars as a way to decrease rising prison overcrowding concerns.(*)
But the graph above shows that this pattern changed in 1993. Suddenly, the gap between the number of admissions to and releases from Texas prisons expanded.
Texas legislators created this imbalance by implementing two separate policy choices that joined together to catapult a seemingly overnight boom in the prison population. First, faced with lawsuits from county officials over jail overcrowding, Texas legislators approved the building of over 100,000 new prison beds within less than five years. Second, in response to public outrage over short prison stays, lawmakers passed legislation to ensure that incarcerated people served a greater proportion of their sentences behind bars. For example, some violent offenders were suddenly required to serve at least 50% of their sentences before they were parole eligible, which effectively doubled the length of prison time for many Texans.(**)
Legislators disregarded the need for balance between admissions to and releases from prison, and the bathtub overflowed. Over two decades later, Texans are still trying to clean up that mess. Sentencing and parole reforms have attempted to decrease the costs of the prison boom, but to truly make an impact on the size of the incarcerated population, policymakers need to understand one thing: prisons are like bathtubs. If you simultaneously open the faucet and cover the drain, you will create a flood.
Suggested reading:
Michele Deitch, “Giving Guidelines the Boot: The Texas Experience with Sentencing Reform,” Federal Sentencing Reporter 6, no. 3 (1993): 138-143.
To see reform efforts underway in Texas, see the Texas Criminal Justice Coalition’s website at http://www.texascjc.org.
Notes:
(*) Michele Deitch, “Giving Guidelines the Boot: The Texas Experience with Sentencing Reform,” Federal Sentencing Reporter 6, no. 3 (1993): 138-143.
(**) Michele Deitch, “Giving Guidelines the Boot,” see footnote (*).
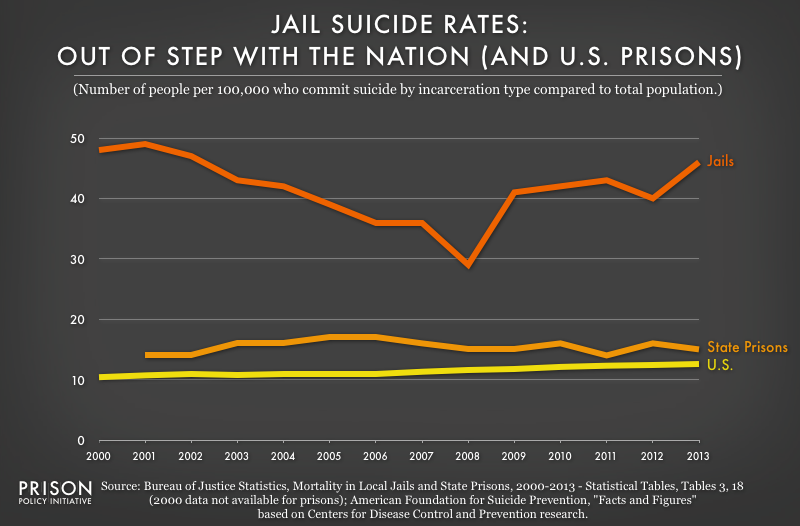
At this unique moment when the public is actually paying attention to local jails, the Bureau of Justice Statistics (BJS) has released a new report based on its Death in Custody Reporting Program showing that the number of people who died while under custody of state prisons and local jails increased for a third consecutive year and, especially troubling, that suicide in jails is a national crisis:
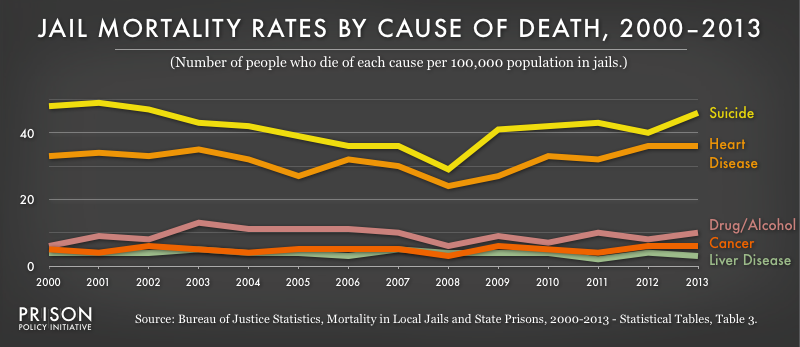
Every year since 2000, suicide has consistently been the leading cause of death in local jails. Overall in the last year, deaths by natural causes declined while unnatural — and presumably preventable — deaths increased. In 2013, over a third of all deaths in jails were suicides:
At the same time as the nation is paying attention to the story of Sandra Bland whose death in a Texas jail may or may not have been a suicide, the BJS data shows that sadly, suicide after the first few days of incarceration is common. Forty percent of people who commit suicide in jail do so within 7 days of admission.
The report underscores that while typically off the public’s radar, local jails should never be ignored. Beyond the fact that almost 12 million people cycle through jails each year, jails house many people who are legally innocent but are too poor to afford bail and those in great need of mental health services. In fact, Cook County, Illinois recently made headlines for doing the unusual: appointing a psychologist to run the county jail, which is actually one of the nation’s largest de facto mental health institutions.
The data also raises the question of whether jails are doing enough to provide adequate medical and mental health care at those high-risk moments when it is needed most. Some states know this is a problem. As Brandon Wood, director of the Texas Commission on Jail Standards, a state agency that has begun to track suicides in Texas jails, told the Houston Chronicle in its in-depth analysis of Texas jail suicides, “After reviewing deaths in custody over the last few years, we keep identifying lapses in observation and proper screening.”
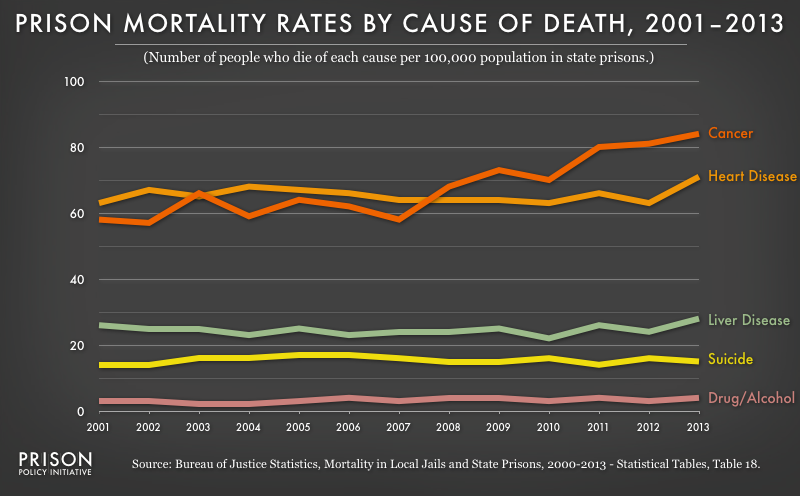
The same BJS report also discusses the very different causes of death in state prisons. In 2013, more than half of deaths in prison were of incarcerated people age 55 or older. Suicide is much rarer, and illnesses are the major cause of death for the aging prison population:
While jails obviously need to address the alarming rate of suicides, the best solution to mortality in state prisons is sensible sentencing and parole reform.
On Sunday, Last Week Tonight’s John Oliver tackled another pressing criminal justice issue: the troubling practice of mandatory minimums. Oliver’s 15-minute segment reveals that incarcerated people and their families aren’t alone in their fight against mandatory minimums. Even the policymakers who first created these sentences and the judges who have to hand them down think that such harsh penalties are ineffective.
Occasional pardons may bring relief to some, but without a system-wide, retroactive change to sentencing laws, mandatory minimums will continue to do “way more harm than good.”
Massachusetts might be poised to join the ranks of states that have struck down one of the most puzzling collateral consequences of a prior drug conviction: an automatic driver’s license suspension.
Let me explain. For more than two decades Massachusetts law has required the automatic suspension of the driver’s licenses of everyone convicted of a drug offense — regardless of whether or not that offense involved driving or road safety. Then, if that wasn’t enough, this policy makes them wait at least six months and then charges them $500 to get their driving privileges back, a fee that many cannot afford.
As our research found, this license suspension policy makes our roads less safe, wastes taxpayer resources, and further destabilizes the lives of individuals with prior involvement in the criminal justice system.
Fortunately, the Massachusetts Legislature is currently considering a bill sponsored by Senator Harriette Chandler and Representative Liz Malia to end the automatic license suspension policy. We presented on the issue at a legislative briefing session earlier this year, and most recently submitted supportive written testimony when H.3039/S.1812 was up for a hearing before the Joint Committee on Transportation last week.
New report answers the question: to what degree do the people in prison in a given county resemble the people who live in the surrounding county?
July 15, 2015
Our newest report asks and answers the question for every county and state in the nation: to what degree do the people in prison in a given county resemble the people who live in the surrounding county?
In partnership with Daniel Kopf of our Young Professionals Network, we analyzed U.S. Census data on the race and ethnicity of people incarcerated in given counties with the corresponding data for the surrounding county.
The racial disparities underlying the United States’ record growth in imprisonment are well documented, as is the fact that the prison construction boom was disproportionately a rural prison construction boom. While these two characteristics have been studied separately, there has been, until now, no national effort to analyze each state’s decision to engage in mass incarceration through a racial geography lens.
This report fills a critical gap in understanding the mass incarceration phenomenon: it offers a way to quantify the degree to which, in each state, mass incarceration is about sending Blacks and Latinos to communities with very different racial/ethnic make-ups than their own.
Our findings include:
Entirely separate from the more commonly discussed problem of racial disparities in who goes to prison, this data addresses a distressing racial and ethnic disparity in where prisons have been built.
Stark racial and ethnic disparities exist between incarcerated people and the people in the county outside the prison’s walls.
The transfer of Black and Latino incarcerated people to communities very different than their own is a national problem not confined to select states.
Hundreds of counties have a 10-to-1 “ratio of over-representation” between incarcerated Blacks and Blacks in the surrounding county — meaning that the portion of the prison that is Black is at least 10 times larger than the portion of the surrounding county that is Black.
We anticipate this analysis will be most useful to address two questions:
To what degree does prison gerrymandering — the practice of using U.S. Census counts of incarcerated people as residents of the prison location for legislative districting purposes — have a racial character in particular states?
The reports contains:
Graphs and maps showing the frequency of racial/ethnic overrepresentation.
Interactive tables and graphics to allow further data exploration and use of the data in new ways.
Summaries of how the racial and geographic disparities stack up by state.
The Attica prison rebellion resulted from a racial/ethnic disparity between the incarcerated and the staff. Decades later, that disparity still hasn't changed.
A driving force behind what New York State called “the bloodiest one-day encounter between Americans since the Civil War” was a shocking racial and ethnic disparity between the incarcerated and the staff at Attica Correctional Facility. But 44 years later, that disparity doesn’t look much different. Not only is this problem not unique to 1971–it’s not unique to Attica or to New York State. Stark racial and ethnic differences between incarcerated people and staff members continue to persist in Attica, New York State, and across the national prison landscape.
The Attica prison rebellion of 1971
On September 9, 1971, a four-day prison rebellion began at the Attica Correctional Facility in New York State. Upset with their difficult living conditions, a group of incarcerated men took control of the prison. Their demands included some common sense changes, like a healthier diet, less mail censorship, and better educational and rehabilitative opportunities. When negotiations failed, Governor Rockefeller ordered the state police to take the facility back while the media watched on. In the assault, 38 people — 29 incarcerated men and 9 hostages — were killed instantly.
In the following years, New York improved the food, mail policies, and rehabilitative programs, but one grievance proved more difficult to fix — the racial and ethnic disparities between the incarcerated and the staff at Attica.
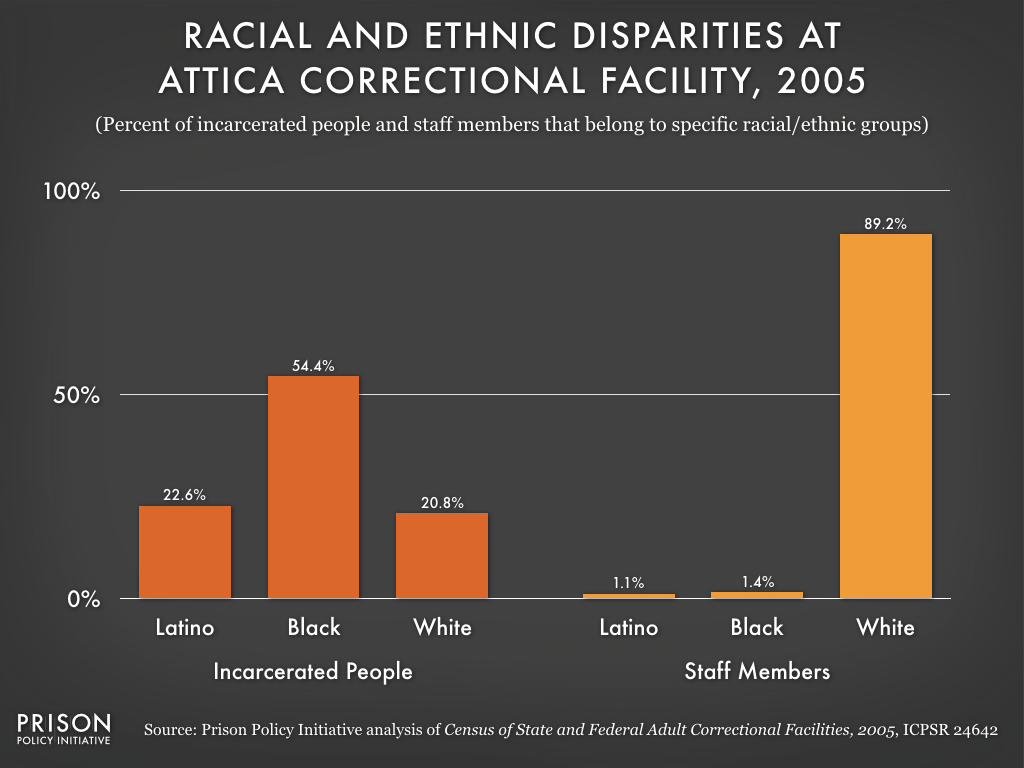
Disparities at Attica
In 1971, 63% of the incarcerated population at Attica was either Black or Latino, but zero Blacks and only one Latino served as prison guards. The graph below shows that little changed in the years that followed:
Decades after the rebellion and massacre at Attica, the numbers of Latino and Black staff members were still very small relative to the numbers of incarcerated Latinos and Blacks. By 2005 (the latest year with complete comparable data), the number of Latinos working at Attica had increased to only 9 employees, or 1% of the facility’s workforce, despite Latinos making up almost 23% the incarcerated population. Similarly, Blacks held only 1.4% of Attica’s staff positions but represented over half (54%) of the incarcerated population.
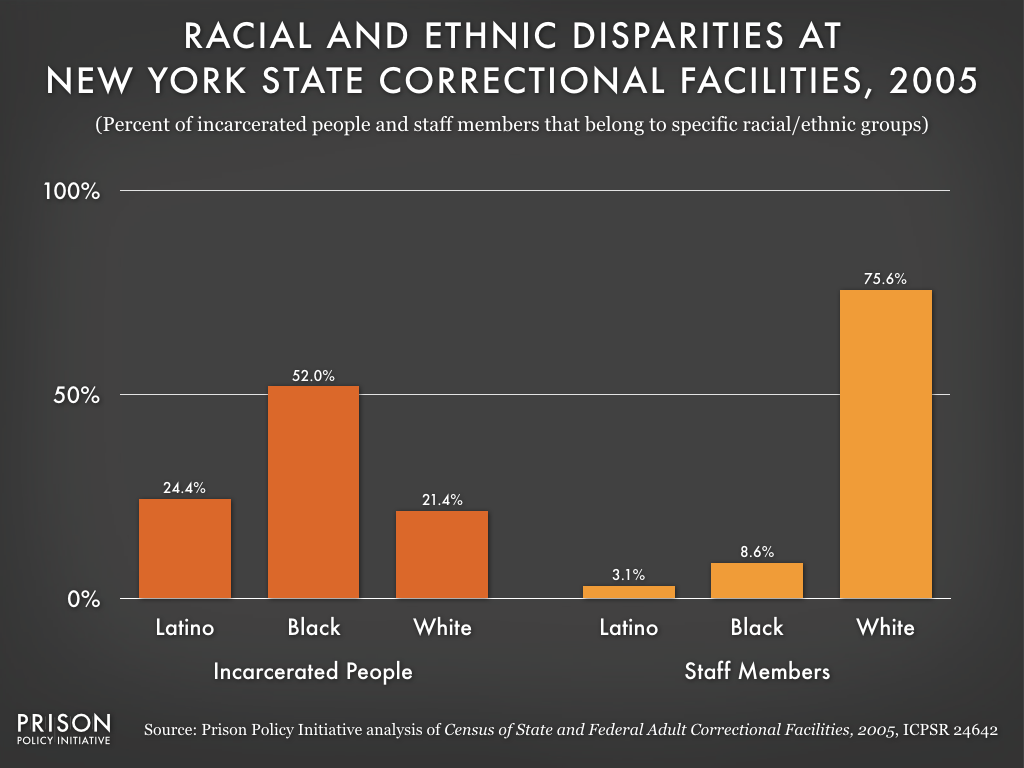
Disparities in New York
The pattern at Attica is echoed at facilities across New York State and illustrated in the graph below:
In 2005, Latinos held 3% of staff positions but represented about 24% of New York State’s incarcerated population. The difference was even more pronounced for Blacks, who held less than 9% of staff positions but represented almost 52% of the incarcerated population. Together, Latinos and Blacks held less than 12% of staff positions but made up over 76% of the incarcerated population.
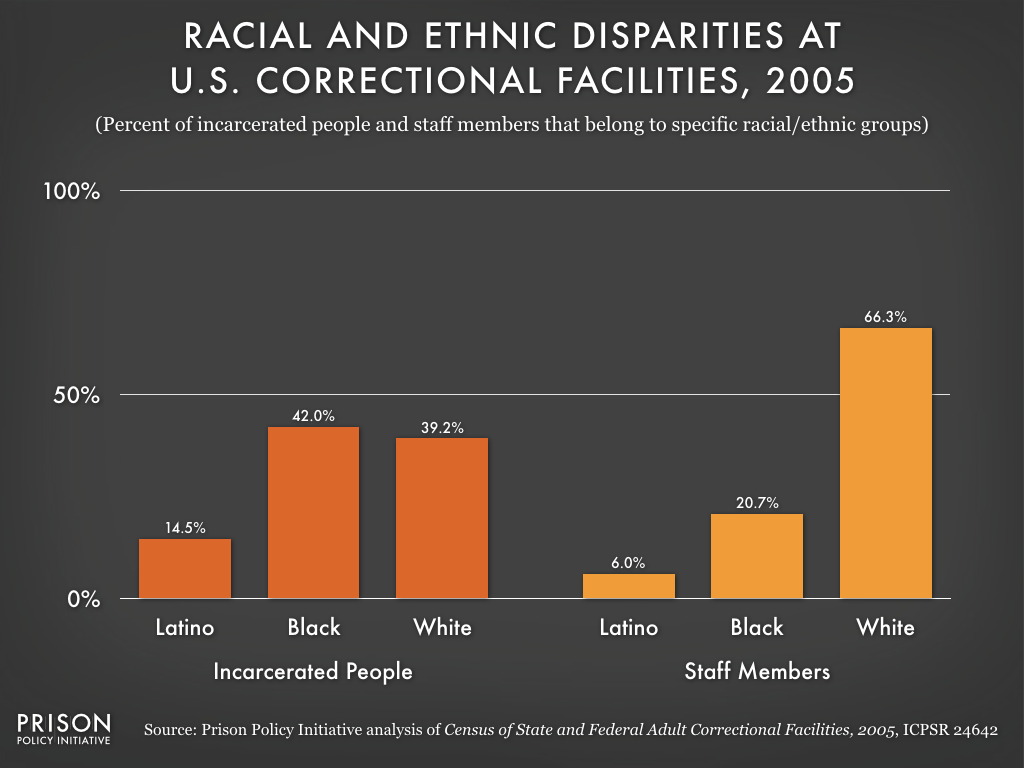
Disparities across the U.S.
New York is not unique in having large racial and ethnic disparities between its incarcerated population and its prison staff members. The graph below shows that this is a national problem:
In 2005, Latinos and Blacks made up over half of the total incarcerated population, but they only held about a quarter of the correctional staff positions. Nationwide, incarcerated Blacks and Latinos are disproportionately overseen by white correctional employees.
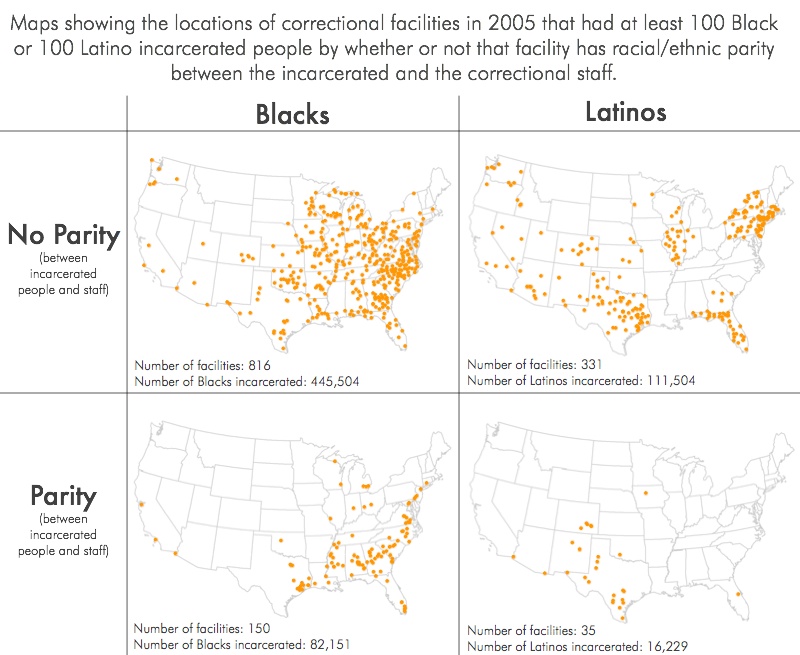
Attica is an extreme case in what is clearly a national problem. Some facilities, however, do have racial or ethnic parity between incarcerated people and correctional staff, and there is a distinct pattern in where such facilities are located. We mapped the facilities that do and do not have racial or ethnic parity (ignoring any facilities that had less than 100 incarcerated Blacks or Latinos):
The maps show that most correctional facilities with more than 100 incarcerated Blacks or Latinos are located in places where hiring Black and Latino staff in proportional numbers to the incarcerated population is extremely difficult. The small number of facilities that have such parity are, unsurprisingly, located in parts of the country with large populations of Black or Latino residents.
(Not shown are 670 facilities that incarcerated less than 100 Blacks and 1,089 facilities that incarcerated less than 100 Latinos. Also excluded from our analysis were 141 facilities that did not report how many Blacks were incarcerated and 324 facilities that did not report how many Latinos were incarcerated.)
Why hasn’t this problem been fixed already?
The lack of progress at Attica since the 1971 rebellion isn’t hard to understand. Incarcerated men there wanted the racial and ethnic makeup of prison staff to change, but the location of the prison could not. Attica remained in a rural, overwhelmingly white part of New York State, while the Latinos and Blacks whom administrators needed to recruit lived in other parts of the state.
Researchers and government officials have known about this problem for more than 40 years. In 1971, the Department of Justice formed a Task Force on Corrections to outline the government’s national criminal justice standards and goals for the first time. After two years of researching and visiting correctional facilities, task force members found that:
“Location has a strong influence on an institution’s total operation. Most locations are chosen for reasons bearing no relationship to rationality or planning. Results of poor site selection include inaccessibility, staffing difficulty, and lack of community orientation.”
In its report, the task force went on to explicitly describe the disadvantages of building new prisons in rural areas. The authors found that rural facilities lead to
“…the consignment of corrections to the status of a divided house dominated by rural white guards and administrators unable to understand or communicate with black, Chicano, Puerto Rican, and other urban minority inmates.”
One member of the task force, leading scholar William Nagel, wrote his own book about the discoveries he made while working on the Department of Justice report. He noted that, by the late 1960s, government leaders were aware that isolating incarcerated people from the rest of society failed to prepare them for life after prison. For example, in 1967, President Lyndon B. Johnson tasked the Commission on Law Enforcement and the Administration of Justice with developing practices that would better reintegrate incarcerated people into their communities.
Nagel therefore expected that he would find evidence that the government was already addressing these problems by building new prisons in populous cities, not isolated rural towns. But he quickly realized that this was not the case. Nagel and his research team found that all new correctional facilities, except for jails in county seats and small special purpose facilities, were being built in rural areas.
And, sadly, things were about to get much worse. After Nagel and his task force published their findings, the prison boom — which was largely a rural prison boom — began in earnest. As researcher Tracy Huling and U.S. Department of Agriculture demographer Calvin Beale noted, a prison opened in a rural town every 15 days throughout the 1990s.
Decades after the Attica rebellion, this country is beginning to grapple with the questions of how, what kind — and how many — prisons it should have. Underlying this discussion should be one basic fact: location matters.
Methodology note:
By “white” this article relies on the Bureau of Justice Statistics numbers for “White, not of Hispanic origin”, and for Blacks, the figure for “Black or African-American, not of Hispanic origin”.
Footnotes
1. United States Department of Justice. Office of Justice Programs. Bureau of Justice Statistics. Census of State and Federal Adult Correctional Facilities, 2005. ICPSR24642-v2.
2. For this article, we define “employees” as full-time and part-time correctional employees.
3. U.S. Department of Justice, Task Force on Corrections of the National Advisory Commission on Criminal Justice Standards and Goals of the Law Enforcement Assistance Administration, Report on Corrections (Washington, D.C.: United States Government Printing Office, 1973), 354.
4. Ibid.
5. William Nagel, The New Red Barn: A Critical Look at the Modern American Prison (New York: The American Foundation, Inc., 1973), 46.
6. Tracy Huling, “Building a Prison Economy in Rural America,” in Invisible Punishment: The Collateral Consequences of Mass Imprisonment, ed. Marc Mauer and Meda Chesney-Lind (New York: The New Press, 2002).
March 19, 2025: Join Prison Policy Initiative’s Advocacy Department at 1 PM EST on Wednesday, March 19, 2025, for a webinar about understanding recidivism. We will cover strategies from our recidivism toolkit, including an overview of recidivism statistics and what they really mean, how to combat the “Willie Horton” effect, and ways that advocates can transform the narrative around reentry to make it less focused on negative outcomes and more focused on the ways that returning citizens contribute to their communities.
April 15-17, 2025: Sarah Staudt, our Director of Policy and Advocacy, will be attending the MacArthur Safety and Justice Challenge Network Meeting from April 15-17 in Chicago. Drop her a line if you’d like to meet up!
Not near you? Invite us to your city, college or organization.
 Now what’s especially interesting about this is that Securus doesn’t currently have a relationship with Sacramento County; in fact, the county’s current phone contract is with competitor ICSolutions. We wouldn’t be surprised to see the contractor change soon, though, as new bids for the contract were due in July.
 Since the beginning of the statistics almost 40 years ago, the probation population has grown much more quickly than either the number of people on parole or the number of people in federal, state and local prisons and jails. While about 2.3 million U.S. residents were behind bars in 2012, almost 4 million residents were under probation.
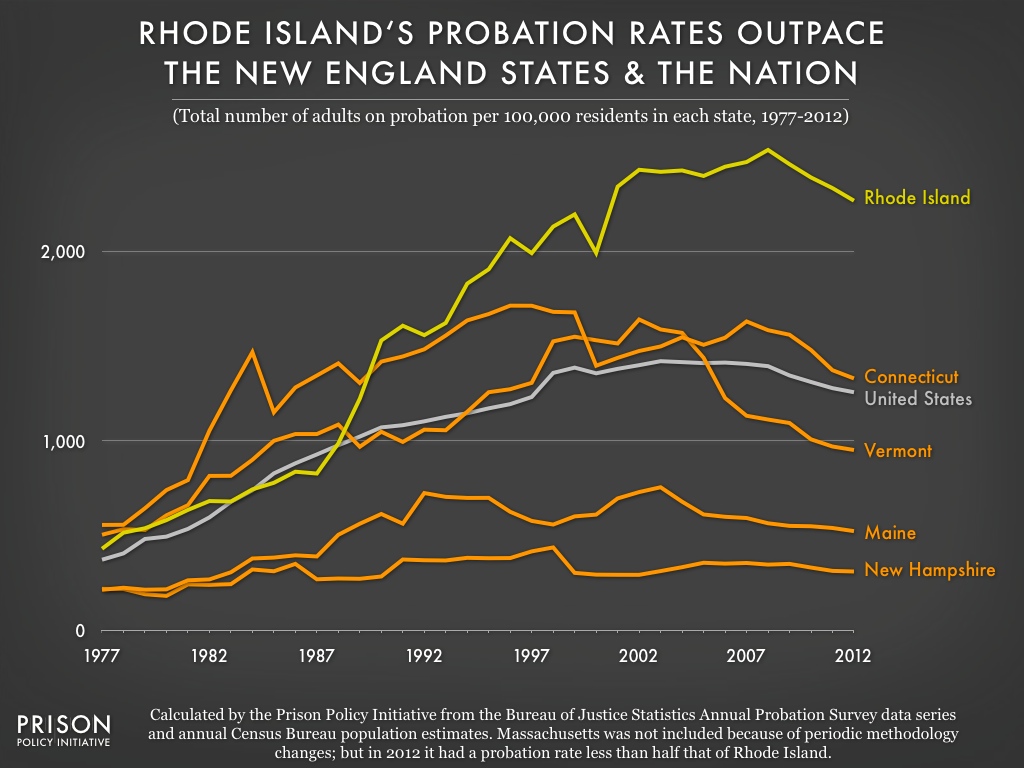 The rate of probation in Rhode Island is more than twice as high as the rate of probation in most other New England states. (Massachusetts was not included in the graph above because the state changed its reporting methods multiple times during the previous decade. However, in the most current available data, Massachusetts reported a rate of 1,033 adults on probation per 100,000 residents, less than half Rhode Island’s rate of 2,268 per 100,000 residents.)
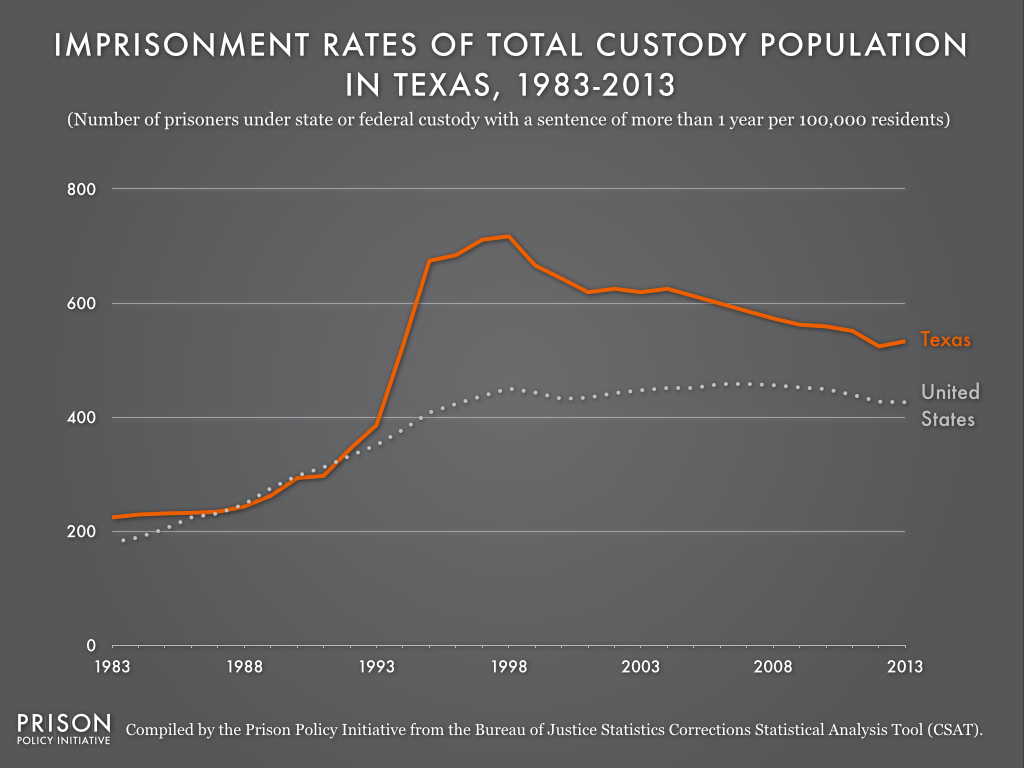 Throughout the 1980s, the Texas imprisonment rate closely matched the national imprisonment rate. But between 1993 and 1998, the Texas imprisonment rate almost doubled, causing Texas’ total custody population to quickly escalate.
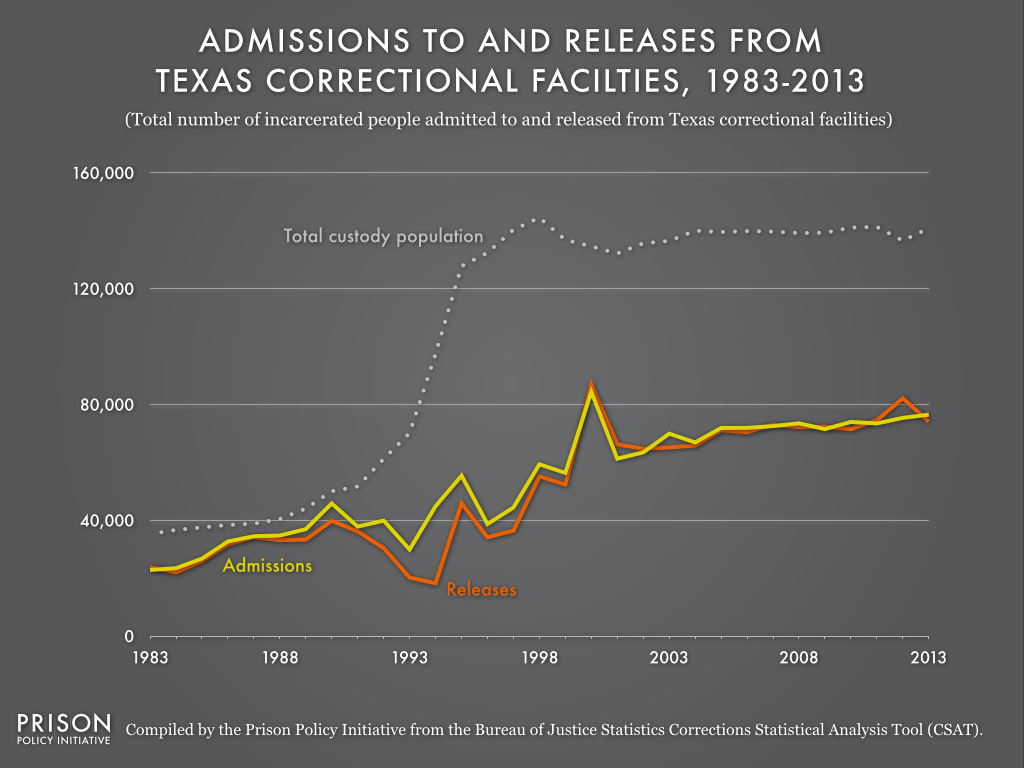 Beginning in 1993, the number of releases from Texas prisons fell behind the number of admissions, allowing the state’s total custody population to rise sharply for the next five years. Once release counts rose again to match admission counts, Texas’ total custody population leveled off and remained stagnant. These patterns show that admissions to and releases from prisons serve as at least one driving force behind rapidly changing prison populations.
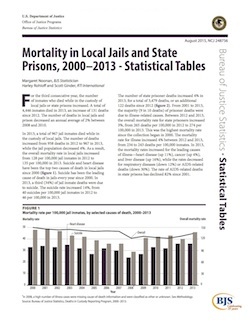
 The maps show that most correctional facilities with more than 100 incarcerated Blacks or Latinos are located in places where hiring Black and Latino staff in proportional numbers to the incarcerated population is extremely difficult. The small number of facilities that have such parity are, unsurprisingly, located in parts of the country with large populations of Black or Latino residents.

