Around the globe, governments respond to illegal activity and social unrest in many ways. Here in the United States, policymakers in the 1970s made the decision to start incarcerating Americans at globally unprecedented rates. The decades that followed have revealed that the growth in the U.S. prison population can be more closely attributed to ideological policy choices than actual crime rates.2 The record also shows that our country’s experiment with mass incarceation has not managed to significantly enhance public safety, but instead has consistently and disproportionately stunted the social and economic wellbeing of poor communities and communities of color for generations.3
In the above graphic, we charted the comparative incarceration rates of every U.S. state alongside the world’s nations.4 While there are certainly important differences between how U.S. states handle incarceration, placing each state in a global context reveals that incarceration policy in every region of this country is out of step with the rest of the world.
The Data
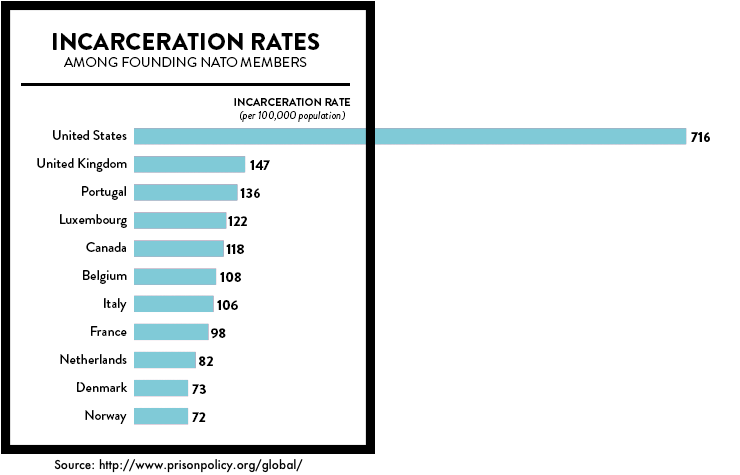
The U.S. incarcerates 716 people for every 100,000 residents, more than any other country. In fact, our rate of incarceration is more than five times higher than most of the countries in the world. Although our level of crime is comparable to those of other stable, internally secure, industrialized nations,5 the United States has an incarceration rate far higher than any other country.
Nearly all of the countries with relatively high incarceration rates share the experience of recent large-scale internal conflict. But the United States, which has enjoyed a long history of political stability and hasn’t had a civil war in nearly a century and a half, tops the list.
If we compare the incarceration rates of individual U.S. states and territories with that of other nations, for example, we see that 36 states and the District of Columbia have incarceration rates higher than that of Cuba, which is the nation with the second highest incarceration rate in the world.
New Jersey and New York follow just after Cuba. Although New York has been actively working on reducing its prison population, it’s still tied with Rwanda, which has the third highest national incarceration rate. Rwanda incarcerates so many people (492 per 100,000) because thousands are sentenced or awaiting trial in connection with the 1994 genocide that killed an estimated 800,000 people.6
Next comes the state of Washington, which claims the same incarceration rate as the Russian Federation. (In the wake of collapse of the Soviet Union, Russia used to rival the United States for the highest incarceration rate in the world. An epidemic of tuberculosis in the overcrowded prisons, however, encouraged the Russian government to launch a major amnesty in 1999 that significantly lowered that country’s incarceration rate.)7
Utah, Nebraska and Iowa all lock up a greater portion of their populations than El Salvador, a country with a recent civil war and one of the highest homicide rates in the world.8 Five of the U.S. states with the lowest incarceration rates — Minnesota, Massachusetts, North Dakota, New Hampshire, and Rhode Island — have higher incarceration rates than countries that have experienced major 20th century social traumas, including several former Soviet republics and South Africa.
The two U.S. states that incarcerate the least are Maine and Vermont, but even those two states incarcerate far more than the United State’s closest allies. The other NATO nations, for example, are concentrated in the lower half of this list. These nations incarcerate their own citizens at a rate five to ten times lower than the United States does:9 10
Conclusion
These data reveal that even the U.S. states that incarcerate the smallest portion of their own citizens are out of step with the larger community of nations. As U.S. states continue to reevaluate their own hefty reliance on incarceration, we recommend that they look to the broader global context for evidence that incarceration need not be the default response to larger social problems.
Methodology
U.S. State data:
The Bureau of Justice Statistics has not published state-level estimates of the U.S. jail population — which makes up 30% of the total mass incarceration pie — since 2006. To fill this gap, we used U.S. Census 2010 data that shows the total number of people in each state who are confined in local, state, and federal adult correctional facilities. This powerful census dataset comes with one quirk worth discussing: the Census Bureau counts incarcerated people as if they were residents of prison locations rather than their home communities. In the case of state prison systems that send a large number of people to prisons in other states, or in the context of federal prisons, this Census Bureau residence determination can influence a state’s incarceration rate calculated with that data. But given the sheer size of the federal prison system alone — larger than the total prison population of every nation on the planet except for seven (China, Russian Federation, Brazil, India, Thailand, Mexico, and Iran) — it wouldn't be appropriate to exclude this population from our data. And while it is the federal government, rather than individual states, that determines how federal criminal laws are written and enforced, state politics certainly influence whether and where federal prisons are built.
Country data:
This report and graphic draws incarceration rates for individual nations from the World Prison Population List, 10th edition, (2013) prepared by Roy Walmsley at the International Centre for Prison Studies (available at: http://www.prisonstudies.org/resources/downloads/wppl_10.pdf). To make the comparisions more meaningful, we’ve chosen to only include nations with a total population of at least 500,000 people. The United Kingdom figure in the graph about incarceration rates among NATO founding members is calculated from the incarceration rates reported by Roy Walmsley's World Prison Population List for the individual nations of England & Wales, Northern Ireland and Scotland.
About
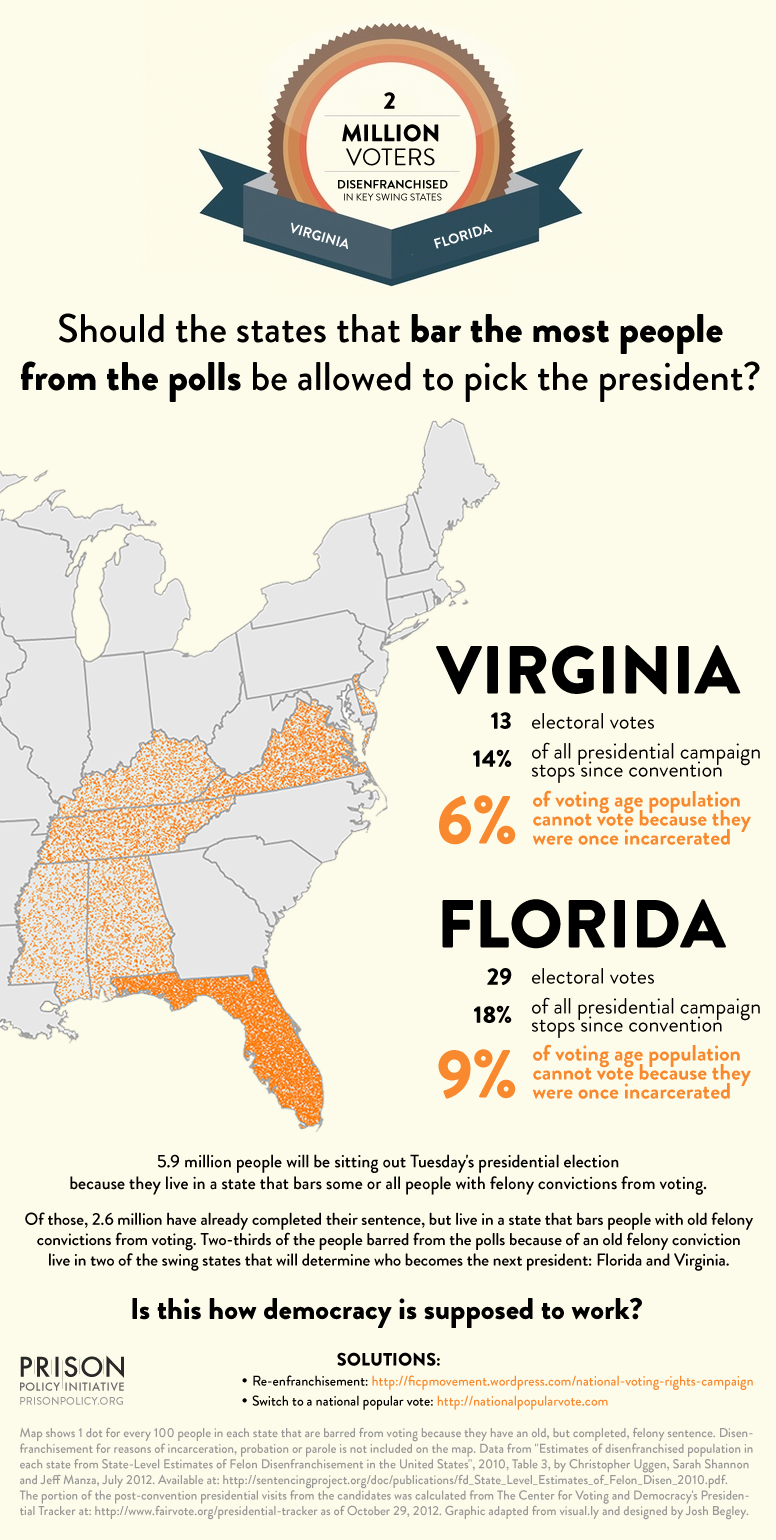
This report was a collaboration between Peter Wagner, Executive Director at the Prison Policy Initiative, Leah Sakala, Senior Policy Analyst at the Prison Policy Initiative, and Josh Begley. Earlier collaborations have included an infographic about whether the states that bar the most people from the polls should in fact be picking the next president and Prison Map, a website exploring the geography of incarceration.

