April 15-17, 2025: Sarah Staudt, our Director of Policy and Advocacy, will be attending the MacArthur Safety and Justice Challenge Network Meeting from April 15-17 in Chicago. Drop her a line if you’d like to meet up!
Not near you? Invite us to your city, college or organization.
Last week we wrote about the psychological differences between in-person and video communication. This week, we decided to look into how incarcerated people and their families feel about using video visitation and how this compares to the expectations that sheriffs have when they adopt video visitation.
In 2009, the Travis County Sheriff’s Office in Texas made the transition from 100% face-to-face visitation to 50% face-to-face and 50% video visitation. In 2013, the Sheriff’s Office went further, eliminating in-person visitation in favor of 100% video visitation.
What arguments do sheriff’s offices make to support the decision to ban in-person visitation in favor of video-only visitation? Some claim video visitation is more efficient, allows for more frequent visitation, and can reduce the introduction of contraband into correctional facilities.
Claim: Video visitation is more efficient.
Travis County’s experience: Travis County’s experience shows that visitation and in-person visitation can be used together to allow for increased efficiency and a greater frequency of visits. For example, the average wait time for a face-to-face visit before the Travis County Sheriff’s Office offered video visitation was 1.5-3 hours. When the jail offered both video and face-to-face visitation, the average wait time was reduced by half. With video visitation as the only option, appointments did drastically shorten wait time, but the wait can still be up to a full hour when an appointment is not scheduled in advance. While pre-scheduling visitation can be beneficial for some families, we’ve spoken to many who find coordinating issues like transportation to the jail, childcare, and employment ahead of time to be difficult.
Claim: Video visitation allows for more frequent visitation.
Travis County’s experience: The Sheriff’s Office found that the average number of visits per year was highest when they offered both video and face-to-face visitation, leading to about 1,429 more visits per month than when the Sheriff’s Office only offered in-person visits. The number of visits dropped dramatically when the Sheriff’s Office went to video-only visitation.
Claim: Video visitation can reduce the introduction of contraband into correctional facilities.
Travis County’s experience: Because many in-person jail visits are conducted through glass, there is no reason to think that video would lead to a greater reduction in contraband than a through-the-glass visit. In fact, according to a report by Grassroots Leadership and the Texas Criminal Justice Coalition, disciplinary cases in Travis County jails for possession of contraband increased an overall 54% following the elimination of all in-person visitation.
Claim: Incarcerated people and their families will love video visitation.
Travis County’s experience: Two years after changing to video-only visitation, the Travis County Sherriff’s Office surveyed visitors about their experience with video visitation. A majority of the respondents had experienced both in-person and video visitation at the jail and 43% had never had face-to-face visitation at the jail.
While the majority rated their experience with video visitation as positive, almost all (91%) reported they would prefer face-to-face visitation.
Visitors prefer face-to-face visitation, even when that requires the visitor and incarcerated person to be separated by glass. As we reported last week, the reasons for this preference are numerous: video communication reduces the natural flow of conversation, slows the process of establishing trust, prohibits the intimacy and social connection that come with in-person visits, and leads to shorter conversations and reduced interactivity. Another reason for this preference might come from the fact that over 90% of video visits in Travis County took place at the jail and not from a home computer, making video far less convenient than one might think. It looks like visitors prefer face-to-face even if it means waiting longer to visit.
So taking all of these factors into account, what did the Travis County Sheriff’s Office decide to do?
In 2015, the sheriff’s office announced it would move back in the right direction by reinstating in-person visitation and only offering video visitation as a supplemental option. We hope that other county sheriff’s offices will follow suit or will, at the very least, start surveying incarcerated people and their visitors about their experience with video visitation.
Jails continue to adopt video visitation, often at the expense of in-person visits. What does current psychological research say about the key differences between video and in-person communication?
As we reported in January 2015, jails are increasingly adopting video visitation services and 74% of county jails that implement video visitation then ban in-person visitation. As this harmful trend continues to grow, we decided to dig into the research and look into the key differences between video and in-person communication.
Since the advent of the AT&T Picturephone in the 1960s, psychologists have been comparing various kinds of video communication with face-to-face interactions. While there are benefits to video communication, primarily regarding long-distance communication, psychologists have repeatedly found numerous differences between face-to-face and video communication. Video communication, and therefore video visitation, falls short of in-person interactions across six major aspects of conversations:
Video communication increases the formality of the conversation, regardless of the relationship between the two communicators, as evidenced by longer utterances with fewer interruptions.1 This means people are more likely to be talking at one another when they are using video technology rather than having a more natural conversation.
With video communication, there is less opportunity for visual signals that facilitate listener understanding. Visual signals such as head nods, eye contact, and facial expressions are key to in-person interactions but are difficult to recognize in video communication.2
The process of establishing trust takes longer via video communication than in face-to-face conversations where almost spontaneous trusting behaviors can occur.3 This is especially worrisome since video technology is sometimes used between incarcerated people and doctors (tele-medicine) as well as between incarcerated parents and their young children.
The absence of mutual eye contact and a shared visual field disrupts communication and decreases conversational fluidity, which in turn limits the ability to discuss more complex topics and concepts.4 This can be even trickier with correctional video visitation where the visitors are able to see inside the housing units or pods of cells. As you can imagine, this can be distracting.
Video communication has a higher frequency of social distance indicators than in-person communication, suggesting that it is more difficult for people to express intimacy and social connection with video communication.5
The decreased content and process coordination in video communication leads to shorter conversations, reduced interactivity, and less complex utterances.6
The current psychological research is clear: in-person and video communication are not equivalents. However, more research needs to be done that specifically compares the effects of correctional in-person visitation and video visitation. This research should make sure to include factors such as eye contact and the ability to build and maintain trust over video. What we already know is that in-person visits have long been crucial to incarcerated people’s rehabilitation process and that families have been frustrated with the shortcomings of video communication. Too many jails are ignoring psychological research and correctional best practices when they replace in-person visitation with video visitation.
Endnotes
1 Doherty-Sneddon, G., Anderson, A, O’Malley, C., Langton, S., Garrod, S., and Bruce, V. (1997). Face-to-face and video-mediated communication: A comparison of dialogue structure and task performance. Journal of Experimental Psychology: Applied, 3(2), 106. http://dx.doi.org/10.1037/1076-898X.3.2.105.
2 Doherty-Sneddon, G., et al., 122.
3 Gill, A.J. and Gergle, D. (2008). The Language of Trust Establishment in Face-to-Face and Video-Mediated Communication. Conference Papers — International Communication Association, 4.
Country music star Merle Haggard spent 49 years trying to convince this nation that discriminating against the formerly incarcerated is bad social policy.
Country Music star Merle Haggard died today on his 79th birthday. Unlike Johnny Cash who also made the pain of incarceration a central theme in his work, Haggard actually did serve time. And, ironically or perhaps luckily, Haggard was in the audience at Cash’s very first concert at a prison, and that experience led him him to take up a career in music.
But Haggard didn’t leave his roots behind. Of his many songs about incarceration, my favorite is “Branded Man” about the discrimination faced by formerly incarcerated people: “No matter where I’m living, the black mark follows me,” he sings. “I’m branded with a number on my name.”
Here is a live performance from 1968:
The song, which peaked at #1 in 1967, is still in frequent rotation on country music stations. Merle Haggard deserves credit for 49 years of trying to teach this country just how short-sighted it is to hold past mistakes against people. As he sings in the chorus:
I’d like to hold my head up and be proud of who I am But they won’t let my secret go untold I paid the debt I owed them, but they’re still not satisfied Now I’m a branded man out in the cold
Now Merle Haggard went on to become famous, in no doubt because, as Rolling Stone put it last year: “Luckily for Haggard, his music career never again required him to answer the ‘have you ever been convicted of a crime?’ question on a job application.” It’s well past time to extend that right to more people.
Although much attention has been dedicated to the fact that educational and job training programs can reduce recidivism amongst people being released from prisons and jails in the United States, policymakers, academics, activists, and citizens alike would do well to devote greater attention to the forms of disadvantage that make people more likely to end up behind bars in the first place. As we demonstrate in our July 2015 report on pre-incarceration incomes of people in prison, the American criminal justice system incarcerates people who had a median annual income 41% less than that of their non-incarcerated counterparts before their incarceration. In this blog post, we examine disparities in literacy rates as another avenue for understanding who ends up behind bars in the world’s largest prison system.
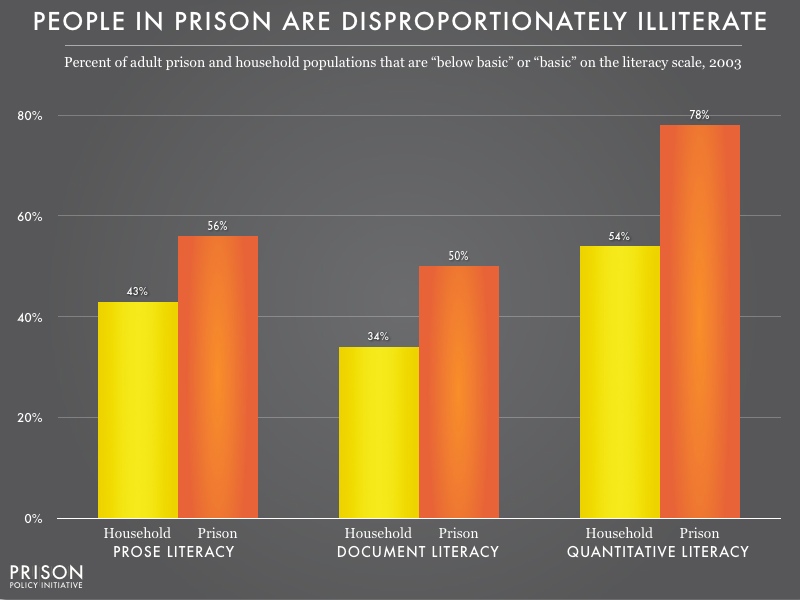
In 2003, the U.S. Department of Education conducted the National Assessment of Adult Literacy (NAAL) survey, assessing the English literacy of incarcerated adults for the first time since 1992. The assessment was administered to approximately 1,200 people incarcerated in state and federal prisons, as well as 18,000 non-imprisoned Americans. The NAAL found that there was a significant difference between the literacy rates between incarcerated individuals and their non-incarcerated counterparts:
People in prison are 13 to 24 percent more represented in the lowest levels of literacy than people in the free world. The smallest disparity is for prose literacy, and the largest disparity is for quantitative literacy. (For an explanation of the different types of literacy, and why “basic” literacy is inadequate for our modern society, see my appendix below.)
The fact that people in prison had significantly lower median incomes before prison than their non-incarcerated counterparts and that people in prison have significantly lower levels of literacy than non-imprisoned individuals show who is most vulnerable to incarceration: those without access to jobs or quality education fill cells, while those with a larger share of the nation’s resources have a far greater chance of avoiding incarceration.
This is not a new fact: poverty, lack of quality education, and little job opportunity have been central to the argument of prison vulnerability for decades. However, the 2003 NAAL study reveals an additional disparity that speaks to the “is it race or class?” debate in mass incarceration:
Looking at the 2003 NAAL study and focusing on the two lowest categories of literacy proficiency, “below basic” and “basic”, reveals striking disparities. Incarcerated Black and Hispanic adults had lower levels of literacy than whites; and incarcerated white adults had lower literacy than non-incarcerated white adults. This is unsurprising. What is notable, however, is that the study also found that Black and Hispanic non-incarcerated adults have lower literacy scores than white adults outside or inside of prison. This data is strong evidence that the U.S. educational system may be failing people along racial lines.
On average, non-incarcerated Black and Hispanic adults are more likely to have “below basic” or “basic” literacy scores than incarcerated white adults.
Percentage of population that has “below basic” or “basic” literacy, by literacy type
Literacy type
Prose
Document
Quantitative
Black adults in households
67%
59%
79%
Hispanic adults in households
74%
64%
83%
White adults in prison
41%
33%
64%
To me, this data implies that in ending mass incarceration, we will need to grapple with how our educational system is failing large portions of our nation — to the detriment of everyone.
Corey Michon, a graduating Senior at Williams College, wrote this article as part of her 2016 Alternative Spring Break experience at the Prison Policy Initiative. She is looking forward to the publication of updated NAAL data in the summer of 2016.
Appendix: Literacy Types and Literacy Proficiency
Types of Literacy
The 2003 NAAL study address three types of literacy and defines each as the following:
Prose literacy: The knowledge and skills needed to search, comprehend, and use information from continuous texts. Prose examples include editorials, news stories, brochures, and instructional materials.
Document literacy: The knowledge and skills needed to search, comprehend, and use information from noncontinuous texts. Document examples include job applications, payroll forms, transportation schedules, maps, tables, and drug or food labels.
Quantitative literacy: The knowledge and skills needed to identify and perform computations using numbers that are embedded in printed materials. Examples include balancing a checkbook, computing a tip, completing an order form, or determining the amount of interest on a loan from an advertisement.
Categories of Literacy Proficiency
The 2003 NAAL categorizes literacy levels with 4 descriptors (below basic, basic, intermediate, and proficient), and defines each as the following:
Below Basic: Indicates that an adult has no more than the most simple and concrete literacy skills.
Basic: Indicates that an adult has the skills necessary to perform simple and everyday literacy activities.
Intermediate: Indicates that an adult has the skills necessary to perform moderately challenging literacy activities.
Proficient: Indicates that an adult has the skills necessary to perform more complex and challenging literacy activities.
Examples for Each Type and Category of Literacy
The following are examples of tasks for each type and category of literacy provided by the NAAL 2003 study.
Below Basic Examples Prose: Identify what it is permissible to drink before a medical test, based on a short set of instructions. Document: Circle the date of a medical appointment on a hospital appointment slip. Quantitative: Add two numbers to complete an ATM deposit slip.
Basic Examples Prose: Find, in a long narrative passage, the name of the person who performed a particular action. Document: Determine and categorize a person’s body mass index (BMI) given the person’s height and weight, a graph that can be used to determine BMI based on height and weight, and a table that categorizes BMI ranges. Quantitative: Calculate the cost of a sandwich and salad, using prices from a menu.
Intermediate Examples Prose: Explain why the author of a first-person narrative chose a particular activity instead of an alternative activity. Document: Enter product numbers for office supplies on an order form, using information from a page in an office supplies catalog. Quantitative: Determine what time a person can take a prescription medication, based on information on the prescription drug label that relates timing of medication to eating.
Proficient Examples Prose: Compare and contrast the meaning of metaphors in a poem. Document: Apply information given in a text to graph a trend. Quantitative: Calculate the yearly cost of a specified amount of life insurance, using a table that gives cost by month for each $1,000 of coverage.
Massachusetts Governor Charlie Baker signed into law a bill to end license suspensions for people convicted of drug offenses unrelated to road safety, eliminating a major barrier toward successful re-entry.
Today in Massachusetts, Governor Charlie Baker signed into law a bill to end driver’s license suspensions for people convicted of drug offenses unrelated to road safety. With the passage of this bill, Massachusetts eliminates a 27-year-old law requiring automatic suspensions, plus a reinstatement fee of $500, for anyone found guilty of a drug offense.
In a statement, Governor Baker acknowledged that access to transportation is critical for people seeking to find gainful employment and fulfill family obligations.
While the new law will not bring relief to people convicted of drug trafficking, others convicted of less serious drug offenses will see their licenses returned within 30 days.
Yesterday, March 23, 2016, the federal courts issued a second stay of the Federal Communications Commission’s historic October 2015 order that would have expanded regulations of the prison and jail telephone industry to in-state calls and ancillary fees.
It’s a little complicated because on March 16, the FCC issued a public notice reminding the phone companies that the interim rate caps of $0.21/minute (debit/prepaid) and $0.25/minute (collect) should apply to in-state calls. Just as expected, the companies went running to the courts in response. The bad news is that, for now, the courts have sided with these billion-dollar interests that have been price gouging families for far too long. The good news is that families will benefit from the bans and caps on ancillary fees, which can double the cost of a call.
Barring new court developments, here is what families of incarcerated people can expect to be charged:
For prisons, in effect now:
Inter-state calls will continue to be capped at a maximum of $0.21-$0.25/minute for debit/prepaid or collect, respectively. These are the rate caps that went into effect in February 2014. For now, in-state calls are not subject to rate caps.
Payment by phone or website: $3 (previously up to $10)
Payment via live operator: $5.95 (previously up to $10)
Paper bills: $2 (previously up to $3.49)
Markups and hidden fees embedded within Western Union and MoneyGram payments: $0 (previously up to $6.95)
Markups and hidden profits on mandatory taxes and regulatory fees: $0 (We’ve seen these markups and hidden profits on “mandatory” taxes be 25% of the cost of the call)
All other ancillary fees: $0. (There are many of these charges. Some of the most egregious ones are $10 fees for refunds, $2.50/month for “network infrastructure” and a 4% charge for “validation”.)
For jails, starting June 20, 2016:
Inter-state calls will continue to be capped at a maximum of $0.21-$0.25/minute, depending on whether the call is debit or collect. These are the rate caps that went into effect in February 2014. For now, in-state calls are not subject to rate caps.
The caps on the abusive fees discussed above will go into effect for calls from jails on June 20th.
After the court’s partial stay on the FCC order is lifted
Assuming that the federal court eventually sides with the FCC and allows the October order to go fully into effect, families can expect to see the following results at a later date:
The following rate caps will apply to in-state calls:
In prisons, the cost of a call will drop to $0.11/minute.
In jails, the cost of a debit/prepaid call will fall to $0.14/minute to $0.22/minute, depending on the size of the jail. (Traditional collect calls will initially be higher and then, over a two-year period, fall to the $0.14-$0.22/minute level.)
For both prisons and jails, the companies will be prohibited from defying the FCC’s rate caps by steering families to abusive “single call” products like Text2Connect™ and PayNow™ that charge $9.99-$14.99 for a single call.
The court has not set a schedule for the case yet, so we do not know when the partial stay might be lifted.
International calling and advanced communication services
The FCC also sought comments on regulating international calling and advanced communications services like video visitation and email, so the FCC is likely considering regulations of those services as well. The comment period closed in January, and we do not know when the FCC will rule on those issues.
Update March 30, 2016: The FCC has clarified what rules are in effect.
The Mississippi Department of Corrections sent me an interesting press release last Friday about the state dropping the cost of prison phone calls from 22 cents to 11 cents per minute. The timing coincides with the FCC’s March 17 deadline, but the low rate is notable – and not just because Mississippi once ranked 48th in the country in call affordability. Under the terms of the Federal courts’ stay, states were only obligated to reduce their prepaid and debit rates to 21 cents per minute.
Now 11 cents isn’t a random figure. It’s the cap the FCC ordered, now stayed by the court. Back in 2015, the FCC concluded that 11 cents was a reasonable maximum rate for prisons to charge. This price limit was set to go into effect before the federal appeals court put certain sections of the FCC’s order on hold. Mississippi opted to go ahead with a rate of 11 cents voluntarily.
What prompted the steep decrease in Mississippi? In the third paragraph, Commissioner Marshall Fisher expresses concern for the families who pay a high price to speak to their loved ones: “We receive constant complaints from inmate family members and others regarding the high cost for phone service…This decision will significantly reduce expenses to the families.”
It looks like Mississippi has turned over a new leaf. The last head of the Mississippi prison system left a very different mark on telephone history. Former Commissioner Christopher B. Epps pled guilty last year to charges stemming from his role in a bribery scandal in which he accepted kickbacks from consultants of private companies, including phone giant Global Tel-Link, in exchange for awarding DOC contracts.
Whatever its motivations are for slashing its rates, Mississippi made an important point. As we reported earlier, a group of nine states came together to argue that the FCC set rate caps too low to account for the costs involved in providing phone service. Mississippi, without stalling or protesting, just proved that the FCC’s rate caps are workable after all.
Earlier this week, a Massachusetts conference committee reached a compromise on a bill that would end the state’s practice of automatically suspending driver’s licenses of people convicted of drug offenses. Since 1989, anyone convicted of a drug offense in Massachusetts, even an offense unrelated to driving or road safety, would receive an additional punishment: the loss of his or her license and a $500 fee to reinstate it.
The Massachusetts Senate approved a stronger version of the bill last year that would have ended license suspensions for all people convicted of drug offenses, including those convicted of trafficking offenses. The version of the bill that ultimately prevailed will include a House amendment that unfortunately allows suspensions for drug trafficking to continue.
The compromise on trafficking means that this issue is not fully resolved. But the bill’s passage and the broad support it received from law enforcement and Attorney General Maura Healey represent declining public support for the War on Drugs’s costly and counterintuitive sentencing policies.
The bill now heads to Governor Baker’s desk.
Update March 24, 2016: We were previously mistaken that the bill would go straight to Governor Baker’s desk following conference committee. After the conference committee reached a compromise, the bill was sent back to the House, which unanimously voted to approve the legislation. The bill will now head to the Senate, which passed a similar version of the bill last year, before reaching the desk of Governor Charlie Baker.
March 24, 2016: The federal courts have issued another stay of the FCC’s order. Please see our new blog post for what to expect.
The Federal Communications Commission’s historic October 2015 order expanding its regulations of the prison and jail telephone industry goes into effect today. It’s a little complicated because prisons and jails have different effective dates, and part of the FCC’s order has been stayed by the federal courts. And on March 16, the FCC issued a public notice — which if the companies stay true to form, they are likely to challenge in court — reminding the companies that in-state calls are also to be capped. Barring new rulings from the court, here is what the families of incarcerated people can expect.
For prisons, starting today:
Both in-state and inter-state calls are capped at a maximum of $0.21-$0.25/minute for debit/prepaid or collect, respectively. (A 15-minute collect call that cost $6 in Arizona yesterday will cost only $3.60 today.(*))
Payment by phone or website: $3 (previously up to $10)
Payment via live operator: $5.95 (previously up to $10)
Paper bills: $2 (previously up to $3.49)
Markups and hidden fees embedded within Western Union and MoneyGram payments: $0 (previously up to $6.95)
Markups and hidden profits on mandatory taxes and regulatory fees: $0 (We’ve seen these markups and hidden profits on “mandatory” taxes be 25% of the cost of the call)
All other ancillary fees: $0. (There are many of these charges. Some of the most egregious ones are $10 fees for refunds, $2.50/month for “network infrastructure” and a 4% charge for “validation”.)
For jails, starting June 20, 2016:
Both in-state and inter-state calls are capped at a maximum of $0.21-$0.25/minute depending on whether the call is debit or collect. (A 15-minute call that today costs $12.75 in Alameda County, California will cost no more than $3.15 (debit) or $3.75 (collect) on June 20th. A 15-minute call today that costs $14+ in Livingston and Mecosta counties, Michigan and Dodge, Kewaunee, and Walworth counties, Wisconsin will cost no more than $3.15 or $3.75 on June 20th.)
The caps on the abusive fees discussed above will go into effect for calls from jails on June 20th.
After the court’s partial stay on the FCC order is lifted
Assuming that the federal court lifts its partial stay and the FCC’s October order goes fully into effect at a later date, families can expect to see the following results:
In prisons, the cost of a call will drop to $0.11 a minute.
In jails, the cost of a debit/prepaid call will fall to $0.14 to $0.22 a minute, depending on the size of the jail. (Traditional collect calls will initially be higher and then, over a two year period, fall to the $0.14-0.22 level.)
For both prisons and jails, the companies will be prohibited from defying the FCC’s rate caps by steering families to abusive “single call” products like Text2Connect™ and PayNow™ that charge $9.99-$14.99 for a single call.
The Court has not set a schedule for the case yet, so we do not know when the partial stay might be lifted.
International calling and advanced communication services
The FCC also sought comments on regulating international calling and advanced communications services like video visitation and email, so the FCC is likely considering regulations of those services as well. The comment period closed in January, and we do not know when the FCC will rule on those issues.
Notes:
* The maximum 15-minute collect call charge allowed under the new rules is $3.75, but Arizona’s in-state collect calls are going to cost $3.60 because of a quirk in how Arizona’s pricing was set up. Previously, Arizona had a high first minute charge and then charged $0.24 a minute. Arizona is choosing to lower the first minute charge to comply with the FCC rules, but isn’t raising the per minute charge. We chose the Arizona example for this post because we knew that that state had in-state collect call rates much higher than the new caps and because Arizona was willing to confirm their then-existing rates. Some other states, like Mississippi, did not respond to repeated requests to confirm the rates charged to families in their state.
Update March 18, 2016: Yesterday, Mississippi finally sent us enough information to determine their new and old rates. Prior to this week, a 15 minute call cost $5.90 ($2.60 to connect plus $0.22/minute). That same call now costs $1.65, because the connect charge was eliminated and Mississippi choose to adopt the $0.11/minute rate required by the FCC but stayed by the court. The press release gives a hint as to why Mississippi made that decision: “‘We receive constant complaints from inmate family members and others regarding the high cost for phone service,’ Commissioner Marshall Fisher said. ‘This decision will significantly reduce expenses to the families.'” The Mississippi Department of Corrections deserves credit for doing the right thing here and we hope other states will follow.
Update March 23, 2016: The FCC has posted a guide to the new rules along with instructions on how to file overcharging complaints.
This Pi Day, the Prison Policy Initiative has an updated version of its mass incarceration pie chart, including more detail on jails and new infographic slideshows
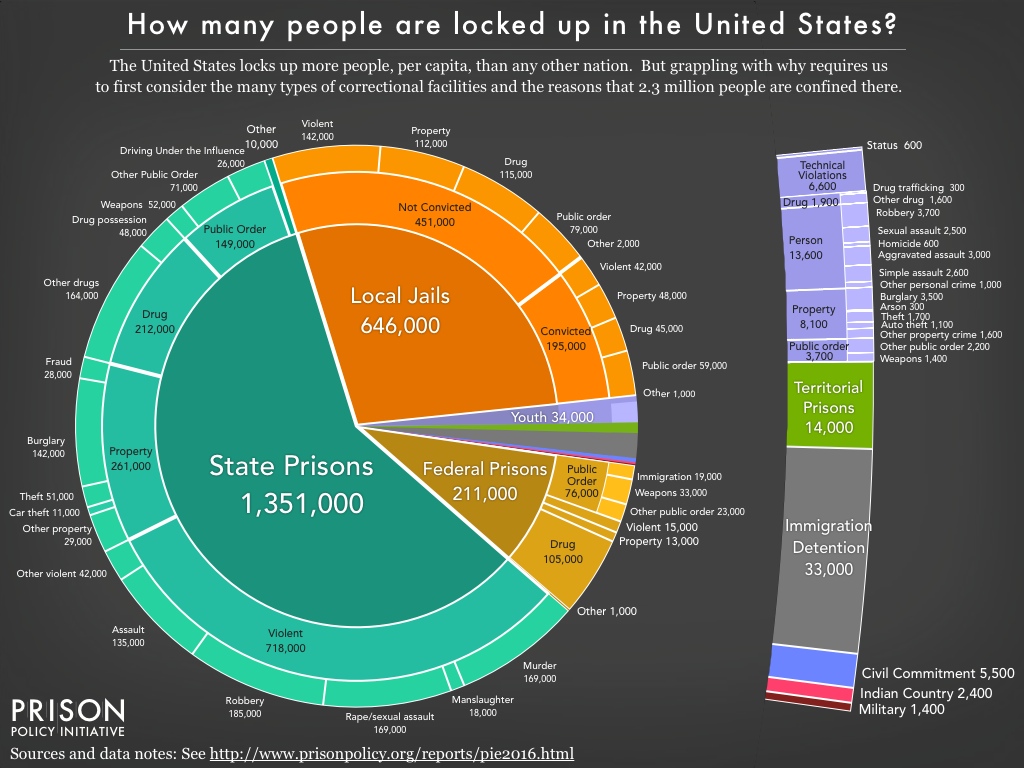
Easthampton, MA — With 2.3 million people locked up in thousands of correctional facilities operated by various agencies, getting the big picture is anything but easy. Today, with the publication of Mass Incarceration: The Whole Pie 2016, the Prison Policy Initiative provides the answer to how many people are locked up in the U.S., where, and why. Building upon our groundbreaking 2015 and 2014 reports, that, for the first time, aggregated the disparate systems of confinement, this updated version allows the reader to drill deeper, including into the reasons that so many people are locked up in local jails.
As we discuss in the report and accompanying infographics, looking at the “whole pie” allows us to cut through the fog to answer key questions such as:
After state prisons, what is the next biggest slice of confinement?
Are there more people in local jails that have been convicted of a crime or have not been convicted?
How does the number of people that cycle through correctional facilities in a year differ from the number of people locked up on a particular day?
Are most people in state and federal prisons locked up for drug offenses?
How many youth are locked up in the U.S. and in what types of facilities?
How does the number of people in correctional facilities compare to the even larger number of people under the supervision of probation and parole?
April 15-17, 2025: Sarah Staudt, our Director of Policy and Advocacy, will be attending the MacArthur Safety and Justice Challenge Network Meeting from April 15-17 in Chicago. Drop her a line if you’d like to meet up!
Not near you? Invite us to your city, college or organization.