Tracking the impact of the prison system on the economy
This country employs more people to run the justice system than to grow food.
by Emily Widra, December 7, 2017
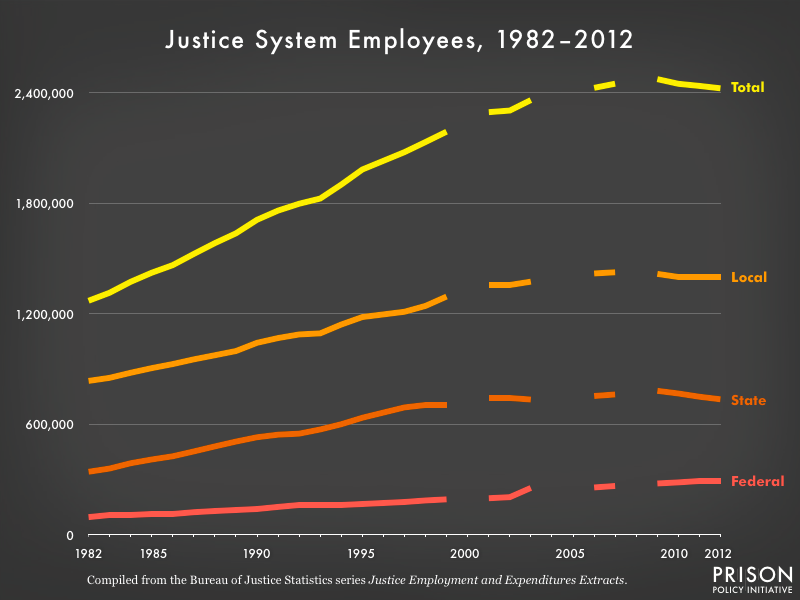
One of the most popular parts of our 2003 book The Prison Index: Taking the Pulse of the Crime Control Industry concerns the economic power of the criminal justice system. I updated three of the graphs and concepts from that book:
 Bureau of Justice Statistics data on the number of justice system employees was not available for the 2000, 2004-2005, and 2008. If you know of a source for this data, please be in touch.
The justice system may have slowed its growth in recent years, but it still has a large hold on the economy. In 2012 — the most recent data available — the more than 2.4 million people who work for the justice system (in police, corrections and judicial services) at all levels of government constituted 1.6% of the civilian workforce.
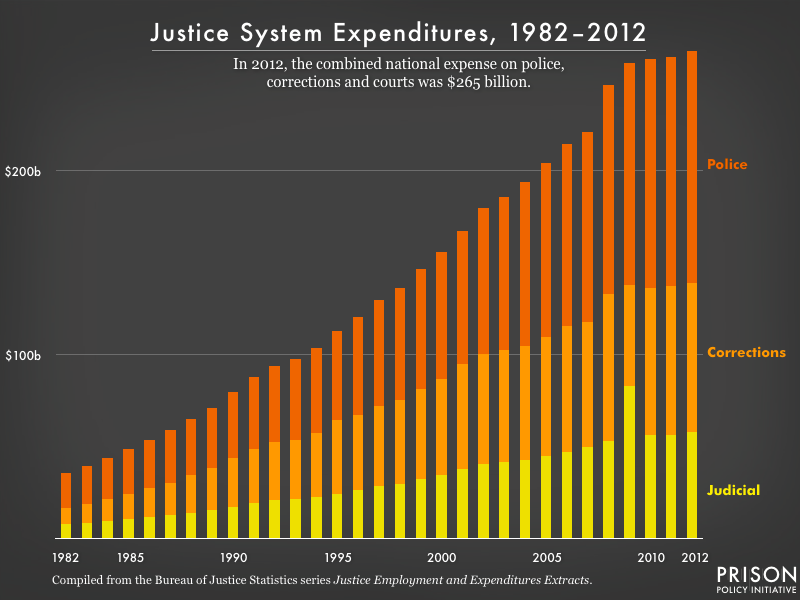
The expenditures are tremendous, having risen from $36 billion in 1982 to $265 billion in 2012:
 These helpful historical figures are different from the our January report Following the Money of Mass Incarceration, which found that mass incarceration costs $182 billion a year. The Bureau of Justice Statistics data counts all justice system expenditures including expenses for the enforcement of civil law, but does not include the various costs to families and defendants. Our report includes those family costs (and offers a detailed breakdown of the expenses) and makes some estimates to exclude those civil costs to focus on criminal law enforcement. While the Following the Money report is useful to answer a lot of specific questions, that analysis is not available over time.
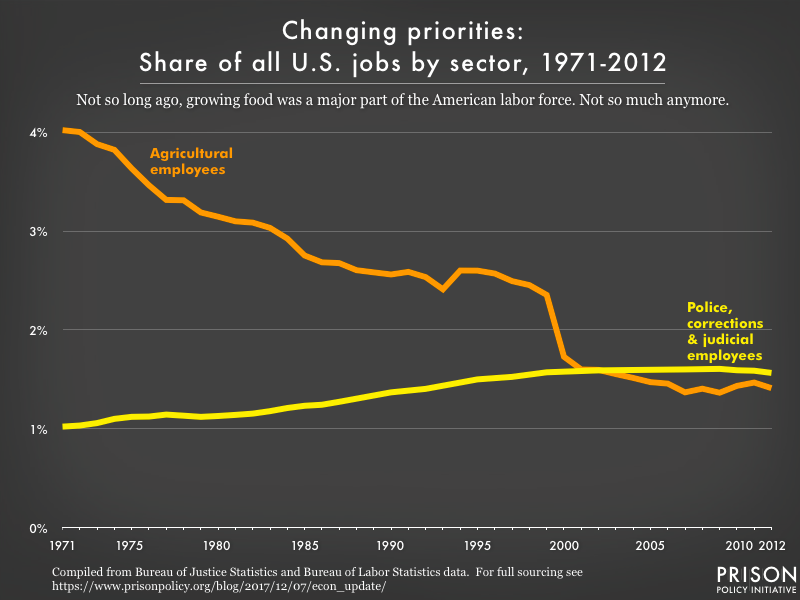
The sheer scale of our nation’s investment in mass incarceration and over-criminalization reflects a larger transformation of our society and our priorities. For example, now more people work for the justice system than work to grow food:
 The 2.3 million incarcerated people in the United States are, of course, excluded from the labor force and therefore are not reflected in analyses of labor force participation. Including them would make the portion of the workforce that is involved in the mass incarceration system even larger.
Looking at the historical data shows this huge system didn’t grow overnight, but that the gradual policy changes that led to mass incarceration have created a powerful lobby to defend the status quo. We have our work cut out for us.
Sources:
The Current Population Survey, conducted by the Bureau of Census for the Bureau of Labor Statistics, reports the number of agricultural workers and the size of the total labor force for each year from 1946 to present.
The Justice Employment and Expenditures Extracts series published by the Bureau of Justice Statistics reports the number of police, corrections and judicial employees for most years from 1982 to 2012. The data for the years 1988, 1989, 1991, 1993, 1994, 1996, 1998, 2000, 2001, 2003-2006, and 2008 were missing, so we imputed by assuming a linear trend between the most recent available years. (We converted these figures to percentages by dividing them by the total labor force figures reported by the Current Population Survey.) Data for 1980 and 1981 did not include judicial employees, so we estimated judicial employment from the 1979 and 1982 values.


It would be interesting to see a chart that shows the number of mental health service providers vs time. Many of the state mental hospitals have been closed and I wonder is those jobs went missing or were replaced by community MH staff or prison staff.
The states had to find money to pay for increased correction staff and maybe some of the money came from the state MH budgets.