New data: The changes in prisons, jails, probation, and parole in the first year of the pandemic
Newly released data from 2020 show the impact of early-pandemic correctional policy choices and what kind of change is possible under pressure. But the data also show how inadequate, uneven, and unsustained policy changes have been: most have already been reversed.
by Wendy Sawyer, January 11, 2022
The Bureau of Justice Statistics (BJS) has released a lot of new data over the past few weeks that help us finally see — both nationally and state-by-state — how policy choices made in the first year of the pandemic impacted correctional populations. Unsurprisingly, the numbers document the tragedy of thousands of lives lost behind bars, and evidence of some of the policy decisions that contributed to the death toll. Drilling down, we also see a (very) few reasons to be hopeful and, for those of us paying close attention, a few notable improvements in what the BJS is able to collect and how they report it. Above all, we see how quickly things can change — for better or for worse — when under pressure, and discuss some of the issues and policy choices these data tell us to watch out for.
Key findings from the BJS reports Prisoners in 2020, Jail Inmates in 2020, and Probation and Parole in the United States, 2020:
- Prison, jail, and probation populations dropped dramatically from 2019-2020,1 but these drops were due to mainly to emergency responses to COVID-19, and correctional populations have already started rebounding toward pre-pandemic levels.

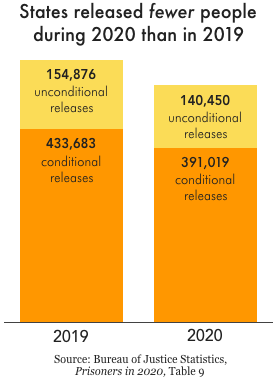
- Nationwide, states and the federal government actually released fewer people from prison in 2020 than in 2019.2 The decrease in the incarcerated population was not related to releases, but rather the 40% drop in prison admissions and 16% drop in jail admissions.
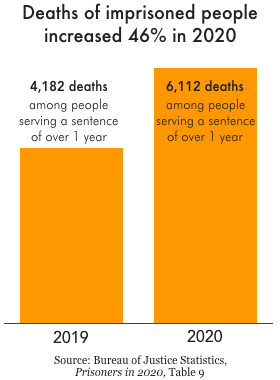
- Deaths increased 46% in prisons from 2019 to 2020, 32% among people on parole, and 6% among people on probation. Jail deaths in 2020 have not yet been reported.
- Even under the pressure of the pandemic, local jails held a larger share of unconvicted people than ever, and continued to hold far too many people for low-level offenses and technical violations.
- State and federal policy responses to the threat of COVID-19 to incarcerated people varied widely, with a few states appearing to basically ignore the pandemic altogether.
It’s not all bad news: A few “silver linings” for women, youth, and others
While most of the significant changes in correctional populations are unlikely to be sustained after — or even during — the pandemic (more on that in the next section), there are a few positive changes that represent possible tipping points or reversals of seemingly intractable problems. With persistent pressure on policymakers, these changes have the potential to stick:
- Women’s prison and jail populations, and incarceration rates, dropped by a larger percentage than men’s populations did.3 This trend held in all but one state prison system (Alaska), reversing the “gender divide” we’ve observed in the past decade of decarceration efforts.
- Indigenous people experienced the greatest drop, proportionally, in jail populations and jail incarceration rates — nearly 35%. Before 2020, American Indians and Alaska Natives had been a population experiencing disproportionate jail growth, almost doubling between 2000-2019.4
- Probation populations were down by over a quarter of a million people in 2020, with far more people going off probation than going on it. With over 3 million people under its thumb, probation is still the leading form of correctional control, and this drop contributed most to the 11% reduction in the overall “footprint” of correctional control.5
- The number of youth held in adult prisons dropped by almost half (46%), and three more states joined the ranks of those no longer holding anyone under 18 in adult prisons, bringing the total to 21.6 Six other states that held large shares (5% or more) of the roughly 650 youth in prison in 2019 also reduced the number of youth held by at least a third in 2020.7
Overall, the “positive trends” in 2020 are nothing to get excited about
In 2020, we did see the kinds of reductions in the number of people under correctional control that we’ll need to see year after year to actually end mass incarceration. And these BJS reports express some of that optimism, with comments like “In 2020, the imprisonment rate was… the lowest since 1992” and “The 15% decrease in persons in state and federal prisons… was the largest single year decrease recorded since… 1926.”
Such dramatic drops in the nation’s use of incarceration would truly be cause for celebration if they weren’t temporary and if they weren’t still “too little, too late” for the thousands of people who got sick or died in a prison or jail ravaged by COVID-19. Unfortunately, there is little reason to think that these drops will be sustained in a post-pandemic world, especially since they have already begun to rebound to pre-pandemic levels, even amid some of the worst outbreaks the U.S. has seen. Above all, we should not expect these trends to hold without sustained reforms, as opposed to temporary “emergency response” changes.
Here, we offer some important context for the trends observed in 2020:

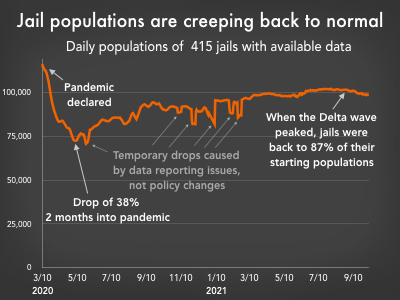
- Nationwide, jail populations have already rebounded to near pre-pandemic levels. While the BJS reports a 25% reduction in jail populations in 2020, that data only covers through midyear 2020 (i.e. the end of June). Because our work trying to shift the nation’s justice system response to COVID couldn’t wait for the official BJS data, we’ve been tracking jail population changes during the pandemic in over 400 county jails using data collected by the NYU Jail Data Initiative. Using that data, we’ve found that the populations of most jails in the sample started climbing back up after July 2020. Overall, the average population change since March 2020 among those jails had diminished to only a 7% decrease by October 2021.
- Jail populations were still too high, even when they were at their lowest in mid-2020. Even in the summer of 2020, after county and city officials had slashed their local jail populations as much as they would at any point in the pandemic (to date, anyway), 1 in 14 jails was still badly overcrowded, holding more people than their rated capacity allows. And in mid-2020, the U.S. still locked up more people per capita in jails alone than most countries do in any type of confinement facilities. That “low” rate of 167 per 100,000 residents is still more than double what it was in 1980.
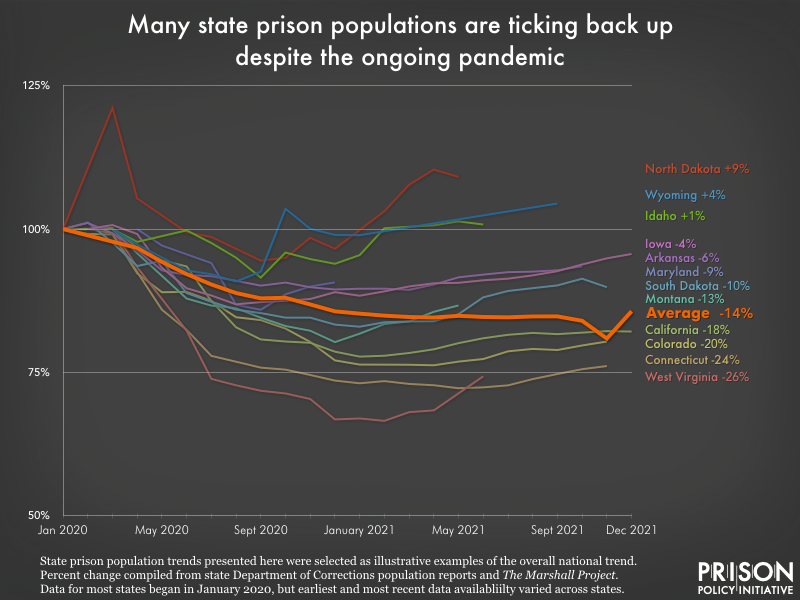
- The decrease in the prison population was also temporary — and has started to bounce back up. Like the jail population changes, the 15% drop in the nation’s state and federal prison population is explained by temporary conditions caused by COVID-19, not long-term policy changes, nor even particularly intentional changes. The combination of trial and sentencing delays in courts and the refusal of some prisons to accept transfers from jails to prevent COVID transmission resulted in far fewer (40% fewer) admissions than usual. With only a few exceptions, state and federal officials made no effort to release large numbers of people from prison. In fact, there were fewer releases in 2020 than in 2019.

- Most of the drop in prison populations occurred within the federal Bureau of Prisons and just three states: California, Florida, and Texas. And even states that reduced prison populations didn’t necessarily reach “safe” population levels (if any prison can be called “safe”). At the end of 2020, 1 in 5 state prison systems were at or above their design or rated capacity. Even California, which reduced its prison population more than any other state (down 25,000) was still locking up more people than its prisons were designed for, and it’s only added more people since then.
- Among people “exiting” parole — either because their sentence was over, they were returned to incarceration, they died, or something else happened — roughly 1 in 5 (over 70,000) were returned to incarceration. This percentage was the smallest it’s been since at least 2005, but during a deadly pandemic that spreads easily in prisons, taking people off of community supervision and returning them to prison should not have been an option. Furthermore, the drop in re-incarceration compared to other years is most likely explained by changes in parole operations, not intentional policy choices: A quarter of agencies responding to a supplementary BJS survey reported suspending reporting requirements for at least a part of 2020.
- As with other forms of correctional control, the reduction in the probation population was due to the COVID-19 emergency, not policy changes, and probation populations were also trending up by the end of 2020. And as with parole, the 35% decrease in returns to incarceration for technical violations, while a welcome change, is largely explained by interruptions in probation operations, and therefore is almost certainly temporary. About half of the agencies responding to BJS’s supplemental survey reported that they suspended all supervision and closed agencies for a period of time in 2020.
Deeply troubling findings: Deaths as “releases” and “exits,” fewer releases amid a pandemic, and bad jail policy choices
Beyond adding context to some of what would otherwise appear to be “positive trends,” our analysis of the 2020 BJS data surfaced some deeply troubling findings about deaths in prison and on community supervision, the failure of states to release more people during the pandemic, and jail policy choices that reveal backwards priorities.
In prisons, BJS reports several disturbing changes from pre-pandemic 2019 to the end of 2020:
- Deaths in prison increased by 46% nationwide. More than 6,100 people died in prison in 2020, which was 1,930 more deaths than in 2019.8 California, Florida, Texas, and the federal Bureau of Prisons all saw more than 500 people die in their prisons in 2020 alone (there have been more deaths since).

- State and federal prisons released ten percent fewer people during the first year of the pandemic, a significant change compared to the typical 1-3% annual fluctuation in the number of releases. Some of this decrease may be explained by slowdowns in parole board functions (we see a lot of drops in “conditional” releases, which would include releases on parole), but in eight states, at least 2% of “releases” were, in fact, deaths. At a time when vaccines were not available and families, advocates, and public health officials were sounding the alarms about the extreme risks of COVID in and around correctional facilities, far more people should have been released from prisons — not far fewer.
As in previous years, there is a lot of data missing about what happens to people on probation and parole; in many states, BJS reports little about how many people complete supervision successfully, how many are returned to jail or prison, why they are returned, etc. But in 2020, one dismal trend was clear: Many so-called “exits” from probation and parole were actually deaths:
- A total of 22,573 people on probation and parole died in 2020, which represents about 2,800 (14%) more deaths than in 2019.
- Exits from parole due to death increased by 32% (1,945 additional deaths) from 2019 to 2020. This accounted for over 2% of parole “exits.”
- Exits from probation due to death increased in 28 of 38 reporting states from 2019 to 2020, an overall increase of over 6% (891 additional deaths). Additionally (and somewhat mysteriously), the number of “other” exits more than doubled (with over 50,000 more “other” exits), but there is no further detail on what those “other” exits might have been.
Getting state-by-state data, such as the BJS made available in the reports on prisons and on probation and parole populations in 2020, is key to bringing some important facts to light that would otherwise be obscured by the larger, nationwide trends. The state-specific data reported by BJS revealed that some states seemed to largely ignore the urgency and seriousness of the pandemic’s impact on correctional populations:
- Alaska’s incarcerated population actually increased by over 2% (over 100 people) in 2020. It was the only state to show an increase during this time. Worse, most of the increase was among the unsentenced (pretrial or pre-sentence) population, which means authorities made a choice to incarcerate many people who weren’t even serving a sentence.
- Nebraska’s prison population dropped only 6.6%, making it one of only three states with less than a 10% decrease. It also has the dubious distinction of being the one state to exceed its most generous measure of capacity,9 at 119% of its prisons’ operational capacity. Perhaps unsurprisingly, Nebraska saw a greater-than-average (71%) increase in deaths in its prisons compared to 2019.
- Five states held more youth under age 18 in adult prisons in 2020 than in 2019: Alaska, Iowa, Nebraska (where their numbers doubled), Pennsylvania, and Tennessee.
- During the pandemic, most states saw reducing incarceration for violations of probation and parole conditions as “low hanging fruit” for depopulating prisons and jails, resulting in a 35% drop in returns to prison for violations nationwide. But six states returned almost the same number of people to prison for technical violations in 2020 as they did in 2019: Arizona, Arkansas, Missouri, Nebraska, Ohio, and Virginia. Not only is locking people up for violations of conditions counterproductive for their success and much more costly, it’s a clearly unnecessary and serious health risk during a pandemic.
Finally, while BJS has not yet released data about deaths in jails in 2020, the jail data suggests some truly confounding policy choices at the local level that year:
- One change likely to have long-term implications is that jail capacity actually grew during the pandemic by quite a bit: The capacity of jails nationwide grew by 6,000 beds in one year (compare that to an increase of 700 beds the year before). With this additional capacity, authorities are able to jail over 5% more people than they were ten years ago.
- In 2020, people in jail spent an average of two days longer locked up in dangerous conditions compared to 2019.10 Overall, the estimated average jail stay has increased by a whole week (31%) between 2010 and 2020. Like the other changes in 2020, the longer jail stays in 2020 are due to changes in courts and prisons related to COVID-19. But whatever the reason, longer stays meant vulnerable people were more exposed to extremely risky jail conditions, when their exposure should have been minimized.
- People who weren’t even convicted of a crime (i.e., those held in jail pretrial) made up a larger share of the total jail population than they have since at least 1995 — probably more than in any other year. At a time when jail populations should have been reduced to the bare minimum, why were jails holding so many legally innocent people?
- In response to the pandemic, many jurisdictions aimed to reduce the use of jails for low-level offenses. But in the summer of 2020, almost 1 in 4 (23%) people in jail were still held for misdemeanors, civil infractions, or unknown offenses — that is, not felonies. Moreover, the practice of jailing people for violations of probation and parole conditions still accounted for almost 1 in 5 (18%) people in jail in mid-2020.11
- Black people made up a larger share of the jail population than they have since 2015, because the 22% jail population drop among Black people was proportionally smaller than the 28% drop among white people. While the difference was not dramatic, this imbalance should serve as a reminder that decarceration efforts must always prioritize racial equity.
Conclusions
The recent data reported by BJS about prison, jail, probation, and parole populations during the first year of the pandemic drive home just how quickly things can change under pressure. By and large, the changes we saw during 2020 were temporary, but they suggest how much is politically and practically feasible when there is a critical mass of support to save lives put at risk by mass incarceration. It’s encouraging to see rapid population drops of 15-25% in prisons and jails, to see the total “footprint” of the carceral system shrink by over 10% in one year, and to see that, when pressed, states and counties can find ways to function without so much reliance on correctional control. It’s also helpful to see the weaknesses in such decision-making, which are put into sharp relief when under the same pressure: Racial equity is too often an afterthought in decarceration efforts, and local-level authorities, in particular, too often lack alternatives to incarceration for low-level offenses and supervision violations, and are too quick to lock up people accused, but not convicted, of crimes. There are many lessons for policymakers and advocates for reform in the data from 2020.
At the same time, the fact that many positive early-pandemic policy changes were so short-lived is disheartening. After all, the pandemic rages on two years later, and correctional populations continue to climb back up — what has changed? For one thing, the narrative has changed: The perception (not a reality) that criminal justice reforms have led to upticks in crime over the past few years has fueled pushback against smart policy changes. That perception is powerful, and history shows that reactionary policies can follow: In the 1980s and 1990s, the last time prison and jail populations were as low as they were in 2020, the knee-jerk reaction to (much bigger) increases in crime was to lock more people up, and for longer. There’s a lesson in that for us, too.
Ultimately, centering the facts in our ongoing discussions about safety and justice — and grounding them with context — will be key to sustaining support for any progress toward ending mass incarceration. Towards that end, the recent data from BJS summarized here about changes during 2020 are essential resources.
Footnotes
-
Specifically, state prison populations dropped 15%, federal prison populations fell 13%, jail populations fell 25%, and probation populations fell 8%. Parole populations increased by just over 1%. Overall, the total number of incarcerated people (i.e., in prisons or jails) fell 18.5% and the total number of people under community supervision (i.e., on probation or parole) fell nearly 7%. The total population under any of these forms of correctional control — that is, the overall “footprint” of the criminal punishment system — shrank by almost 11% (or 676,000 people) from 2019 to 2020. ↩
-
State and federal prisons released 58,404 (10%) fewer people in 2020 than in 2019. ↩
-
Nationwide, women’s jail populations and jail incarceration rates dropped by 37% from 2019 to 2020, while men’s dropped by 23%. The number of women in federal prisons fell 17%; the number of men fell 13%. And the number of women in state prisons fell 24%, compared to a drop of 14.5% among men. Similarly, the female prison incarceration rate (per 100,000) fell by 22%, while the male imprisonment rate fell by 14%. ↩
-
As we discuss in an October 2021 briefing, the growth of the Native population in jails far outpaced the growth of the total jail population over the same time period. Nationwide, jail populations grew 18% from 2000 to 2019, while Native populations grew 85%. Meanwhile, the number of people held in Indian Country jails (that is, jail on tribal lands) also increased by 62%. ↩
-
Importantly, the drop in probation populations was paired with drops in the prison and jail population, so we know that this wasn’t a case of “balloon squeezing,” wherein large numbers of people are simply shifted from one form of correctional control to another. ↩
-
These states now include New York, Utah, and Vermont. Eighteen states already held zero youth 17 or younger in state prisons in 2019: California, Hawaii, Idaho, Illinois, Kansas, Kentucky, Maine, Massachusetts, Montana, New Jersey, New Mexico, North Dakota, Oregon, Rhode Island, South Dakota, West Virginia, Wisconsin, and Wyoming. Sadly, five states actually held more youth age 17 or younger in state prisons in 2020 than in 2019: Alaska (5 in 2019, 8 in 2020); Iowa (0 in 2019, 6 in 2020); Nebraska (7 in 2019, 14 in 2020); Pennsylvania (9 in 2019, 11 in 2020); and Tennessee (9 in 2019, 10 in 2020). No change was reported in Missouri (4 in both years) or Nevada (11 in both years). ↩
-
Six states that held at least 5% of all youth 17 or younger in state prisons in 2019 reduced these populations by at least one-third in 2020: Arizona (55 in 2019, 6 in 2020; Connecticut (52 in 2019, 31 in 2020); Florida (81 in 2019, 44 in 2020); North Carolina (61 in 2019, 29 in 2020); Texas (38 in 2019, 16 in 2020); and Ohio (36 in 2019, 24 in 2020). ↩
-
The Bureau of Justice Statistics reports that 6,112 people under state or federal jurisdiction, serving sentences of over 1 year, were “released” due to death in 2020, compared to 4,182 in 2019. ↩
-
There are three accepted ways to measure prison system capacity. Some states chose to report one, two, or all three of these capacity measures to the Bureau of Justice Statistics. According to the definitions used in Prisoners in 2020, the three major capacity measurements can be defined as:
- Rated capacity: the number of people or beds a facility can hold, as set by a rating official;
- Operational capacity: The number of people a facility can hold based on staffing and services;
- Design capacity: The number of people a facility can hold, as set by the architect or planner.
These three stated capacities can vary greatly within a state. For example, the BJS reports that the design capacity of the Alabama prison system (set by the architect or planner) is 12,388 people, while the operational capacity (based on staffing and service levels) is 22,896 people. In its report, the BJS calculated what percentage of the capacity each jurisdiction was operating at for each available definition of capacity, and reported the custody population as percentage of the lowest capacity and highest capacity. In a state like Alabama, this can create a wide range — the BJS calculated that in December 2020, the state was operating at 79% of its highest capacity measure, which was its operational capacity, and 146% based on its lowest capacity measure, its design capacity. But by any measure, there are too many people in Alabama’s prisons, especially during a pandemic.
↩ -
For people in larger jails (holding over 500 people), the average jail stay was over one month, and in the largest jails (2,500 people or more) the average was over 39 days. ↩
-
These two groups — people held for misdemeanors, civil infractions, or unknown offenses and people held for probation and parole violations — overlap and should not be considered mutually exclusive. ↩


