Press Releases archives

Formerly incarcerated people overwhelmingly want to work, but they face huge obstacles in the job market.

July 10, 2018

Easthampton, Mass. – For the 5 million formerly incarcerated people living in the U.S., landing a job means more than just personal success: It means finding a place in their communities and being able to care for their loved ones again.

It’s well known that the obstacles to finding a job are severe for formerly incarcerated people. The scale of this problem, however, has been difficult to measure – until now.

In Out of Prison & Out of Work, the Prison Policy Initiative calculates that 27% of formerly incarcerated people are looking for a job but can’t find one:

Graph of unemployment rates overtime, for both formerly incarcerated people and the general U.S. population.

This rate, which surpasses anything Americans have experienced since the height of the Great Depression, is especially striking given the report’s other findings:

  • Formerly incarcerated people are more likely than the average American to want to work;
  • People of color and women face the worst “penalties” in the job market after going to prison, making historical inequalities in the labor force even worse;
  • Unemployment is highest for people released in the last two years, when they are most vulnerable to re-incarceration.

Graph comparing unemployment in the general population to the formerly incarcerated population, disaggregated by race and gender.

“These high unemployment rates reflect public will, policy, and practice – not differences in aspirations,” said author Lucius Couloute. In the report, he lays out policy solutions for closing this vast employment gap, including:

  • A temporary basic income for formerly incarcerated people after their release;
  • Automatic mechanisms for criminal record expungement;
  • Occupational licensing reform at the state and industry levels.

Today’s report is the first of three to be released by the Prison Policy Initiative this summer, focusing on the struggles of formerly incarcerated people to access jobs, housing, and education. Utilizing data from a little-known and little-used government survey, Couloute and other analysts can describe these problems with unprecedented clarity. In this report and the two more to follow, they recommend reforms to ensure that formerly incarcerated people – already punished by a harsh justice system – are no longer punished for life by an unforgiving economy.


In a first-of-its-kind data analysis, we explore the economics of prison commissaries in three states.

May 24, 2018

The ongoing – and growing – exploitation of incarcerated people and their families has been a central theme in our work at the Prison Policy Initiative. In our new report, attorney Stephen Raher explores another overlooked but central part of prison life: the commissary. The fairness of prison commissaries is an essential bread-and-butter issue for incarcerated people, who have only the store’s limited options to choose from when the prison fails to provide them with what they need.

In his report, The Company Store: A Deeper Look at Prison Commissaries, Raher analyzes commissary sales data from three states to address questions like:

  • What do people spend the most money on in prison commissaries?
  • How “fair” are prices, compared to “free-world” prices and relative to prison wages?
  • How does the emerging digital market compare to traditional commissary sales, like food and toiletries?

The three states sampled – Illinois, Massachusetts, and Washington – were the few from which we could easily obtain detailed statewide commissary sales data. Fortunately, this sample includes examples of both state-run and privately operated commissary systems, as well as a range of prison population sizes. While we would warn against generalizing broadly based on this small sample, the report highlights a number of issues that merit further study and serious consideration by policymakers.

The purpose and fairness of prison commissary systems come into question in light of the report’s findings:

  • Incarcerated people spent an average of $947 per person annually through commissaries – well over the typical amount they can earn at a prison job. In these three states, an incarcerated worker holding a job supporting the prison, such as food service or custodial work, would usually earn $180 to $660 per year.
  • Incarcerated people buy most items to meet basic needs, like food, hygiene, and over-the-counter medicines, rather than “luxuries.” 75% of the average person’s annual commissary spending in the three sampled states was used to purchase food and beverages, indicating a widespread need to supplement the food provided by the prisons.

Treemap graphic breaking down commissary sales by item type, using data from three states.

The findings also point to the incentives of the prison retail market for private commissary vendors:

  • While private vendors generally charge prices comparable to those found in outside prisons, monopoly contracts and the ability to transfer goods straight from the warehouse to the customer mean vendors’ operating costs are often lower than in the “free world.” Yet their prices do not always reflect these advantages.
  • The most obvious price-gouging is found in new digital services marketed to prisons, such as email and music streaming. Prison and jail telecommunications providers are aggressively pushing these new products and services, where they can charge prices far higher than similar businesses do outside of the prison setting.
  • Even in state-run commissary systems, private companies are poised to profit. In Illinois, the Keefe Group (one of the largest commissary companies) was not contracted to run the commissary, but still made up the dominant share (30%) of the state’s purchases for commissary goods.

Commissaries present yet another opportunity for prisons to shift the costs of incarceration to incarcerated people and their families. Meanwhile, telecommunications contractors with prison contracts are maximizing their revenues by offering more digital services at exorbitant rates. Instead of leveraging incarcerated people to subsidize the prison system by monetizing their every need, the report concludes, states could more effectively cut costs by drastically reducing prison populations.


With this year's updated edition of Mass Incarceration: The Whole Pie, we once again answer the essential questions of how many people are locked up, where, and why.

March 14, 2018

Easthampton, Mass. – Are there 1.3 million people behind bars in the U.S., or is it actually closer to 2.3 million? How many millions more are on probation or parole, one mistake away from ending up back behind bars? The country’s fragmented systems of confinement make answering basic questions about mass incarceration unnecessarily difficult. With this year’s updated edition of Mass Incarceration: The Whole Pie, we once again answer the essential questions of how many people are locked up, where, and why.

Pie chart showing how many people are locked up on a given day in the U.S. by facility and offense type.The first of 11 infographics that give the big picture and the details on who is behind bars, where, and why.

The publication of the new report caps a year-long effort to update the public on the major drivers of incarceration–state prisons and local jails–as well as confined populations too often overlooked, such as juveniles in residential placement and immigrants in detention.

“The big picture is important,” says author Peter Wagner, noting that many criminal justice reforms simply move people from one part of the system to another. “Ending mass incarceration means shrinking the size of the entire ‘pie,’ and not just rearranging where people are held within it.”

Key findings with important policy implications include:

  • Jails admitted nearly 11 million people in 2016–enough to fill prison buses lined up end-to-end from New York to San Francisco.
  • Half a million people are detained in jails before trial every day. In fact, most people in jails are not convicted, and many are there simply because they can’t afford money bail.
  • The vast number of people incarcerated for low-level offenses include nearly 9,000 youth confined for “technical violations” of probation.
  • 2,300 more youth are locked up for “status” offenses that are not even criminal violations for adults, such as running away or skipping school.

This edition of Mass Incarceration: The Whole Pie includes more parts of the system than previous versions of the graphic, not because mass incarceration has expanded, but because we’ve developed a way to offer a more comprehensive view. “We spent the last year collecting data about institutions that may not consider themselves a part of mass incarceration, yet confine thousands of justice-involved people,” said co-author Wendy Sawyer. This update to the report includes more juvenile facilities, adds state psychiatric hospitals, and offers more detailed data on federal corrections.

The United States locks up more people than any other country, at a rate more than five times higher than most other nations. One impediment to reform is the lack of available data to guide that conversation. In Whole Pie, the Prison Policy Initiative provides the comprehensive view of mass incarceration that society needs in order to plot a path forward.

Mass Incarceration: The Whole Pie is one in a series of reports that provide equally comprehensive snapshots of women’s incarceration and youth confinement. Previous national reports from the Prison Policy Initiative include Following the Money of Mass Incarceration, which uses economic data to show who pays for and who benefits from mass incarceration, and Detaining the Poor: How money bail perpetuates an endless cycle of poverty and jail time, which finds that the ability to pay money bail is impossible for many defendants because it represents eight months of a typical defendant’s income.

The non-profit, non-partisan Prison Policy Initiative was founded in 2001 to expose the broader harm of mass criminalization and spark advocacy campaigns to create a more just society. The organization leads the nation’s fight to keep the prison system from exerting undue influence on the political process (via prison gerrymandering) and plays a leading role in protecting the families of incarcerated people from the predatory prison and jail telephone industry and the video visitation industry.

The full report and graphics are available at https://www.prisonpolicy.org/reports/pie2018.html.

-30-


In a series of graphics, we explain how tens of thousands of youth who could be better served in their communities still end up in confinement.

February 27, 2018

Easthampton, Mass. – A map of juvenile justice in America would be daunting, covering 1,852 youth facilities of varying restrictiveness, not to mention thousands of youth held in adult prisons and jails. Youth Confinement: The Whole Pie offers a comprehensive view of this system, breaking down where and why justice-involved youth are locked up.

Pie chart showing the number of youth locked up on a given day in the U.S. by facility and offense type.

In a series of graphics, the report reveals how tens of thousands of youths who could be better served in their communities still end up in confinement. Far from confining “only those youth who are serious, violent, or chronic offenders,” as the juvenile justice system purports to do, this country:

  • Locks up 8,500 youths every day for technical probation violations
  • Detains over 9,000 youths before they’re even tried – and holds 900 in long-term secure facilities, essentially prisons, before they’ve been committed
  • Locks up over 7,500 youths for other low-level offenses, including status offenses (behaviors for which an adult would not be prosecuted)

Youths held pretrial or for minor offenses comprise 1 in 3 held in confinement today – children and adolescents who could be released at virtually no threat to public safety.

The report explores some of the worst harms of excessive youth confinement, including:

  • Disproportionately punishing Black and Native youth, with disparities exceeding even those of the adult justice system
  • Confining most youth in facilities indistinguishable from jails and prisons – or in actual adult jails and prisons
  • Holding youth in “temporary” reception/diagnostic centers for months or even years

The big-picture view offered by Youth Confinement: The Whole Pie suggests opportunities for immediate reform, such as transferring youth to community-based programs and drastically curtailing pretrial detention. “For advocates working to find alternatives to incarceration,” says report author Wendy Sawyer, “ending youth confinement should be a top priority.”

Read the full report.

-30-


Women’s prison populations are largely growing faster than men’s. See our 50-state analysis.

January 9, 2018

Easthampton, Mass. – States have made impressive progress over the last 10 years in reducing their prison populations, but for most women in prison, this progress might as well never have happened. Even as men’s incarceration rates are falling, women’s incarceration rates hover near record highs, a trend driven by criminal justice decisions at the state level. A new report from the Prison Policy Initiative identifies more than 30 states driving this national “gender divide.”

women's incarceration rates: select states and all 50 states

The mass incarceration of women has severe and far-reaching effects: 62% of women, for instance, are separated from minor children when they are put behind bars. But though this is largely an issue of state policy, “few people know what’s happening in their own states,” says Wendy Sawyer, author of The Gender Divide: Tracking Women’s State Prison Growth. Sawyer says states undermine their commitment to decarceration when their criminal justice reforms leave women behind.

For example:

  • Texas recently reduced its men’s prison population by 6,000, while backfilling its prisons with 1,100 more women.
  • Michigan’s female prison population grew 30% from 2009 to 2015, while the number of men in Michigan prisons fell by 8%.
  • Six other states have seen men’s prison populations decline even as women’s populations have climbed.

The report features more than 100 state-specific graphs tracking 40 years of women’s prison growth, designed to help policymakers assess the need for local reform. It also isolates the underlying causes of women’s mass incarceration, including the War on Drugs, harsh sentencing for violent offenses, and the growing frequency of women serving jail time.

Women in prison are uniquely burdened by mental health problems and trauma, and Sawyer notes that most prisons, having been designed for men, “make those problems worse.” But she stresses that the appropriate response “is not to build better prisons – it’s to ensure women are included in reforms that move people away from prisons.” Most women in the justice system could be better served through alternatives to incarceration. Developing those solutions should be an urgent priority in every state.

How are women faring in your state? See the report and state-specific graphs https://www.prisonpolicy.org/reports/women_overtime.html.


New report details the number of women who are locked up by various correctional systems and why.

October 19, 2017

report thumbnailWith 219,000 women locked up in facilities operated by thousands of agencies, getting the big picture is anything but easy. In our new report, Women’s Mass Incarceration: The Whole Pie 2017, we use our “whole pie” approach to give the public and policymakers the foundation to end mass incarceration without leaving women behind.

Our new report details, for the first time, the number of women who are locked up by various correctional systems and why. Women’s Mass Incarceration: The Whole Pie 2017, released jointly by the Prison Policy Initiative and the ACLUs Campaign for Smart Justice, is a first look at where women fall within our decentralized and overlapping systems of mass incarceration.

For example, we find that a quarter of incarcerated women are unconvicted, highlighting serious questions about how we use incarceration in the United States. And the report finds that “[i]n stark contrast to the total incarcerated population, where the state prison systems hold twice as many people as are held in jails, incarcerated women are nearly evenly split between state prisons and local jails.” These findings reinforce the importance of considering jails, not just prisons, in ending mass incarceration.

The report provides a breakdown of offense types for women incarcerated in local, state, and federal correctional systems. And while the distribution of offenses is different for women than for the general incarcerated population, our analysis confirms that meaningful reform and ending mass incarceration requires looking beyond non-violent drug and property offenses.

Incarcerated women have long been overlooked in criminal justice statistics. Women’s Mass Incarceration: The Whole Pie 2017 starts to fills that void.


President Trump supports stop & frisk; but Black and Latino people know from experience that the result is discriminatory use of force.

August 17, 2017

President Trump’s push for tougher policing is dangerous for Black and Latino communities, who bore the brunt of police use of force under stop-and-frisk in New York.

Easthampton, Mass. – Donald Trump’s presidency has heralded a return to ineffective “tough on crime” tactics, including the police practice of stop-and-frisk, but a new report by the Prison Policy Initiative finds that such a move would be disastrous for Black and Latino communities. “Instead of making cities safer, stop-and-frisk causes thousands of forceful and terrifying experiences with police, mostly for people of color who’ve done absolutely nothing wrong,” charges Rose Lenehan, author of the report.

In What “Stop-and-Frisk” Really Means: Discrimination & Use of Force, Lenehan analyzes the racially disparate use of force in police stops in New York City in 2011. That year was the peak of stop-and-frisk in the city, and two years before a federal judge found that the practice was racially discriminatory and violated the rights of hundreds of thousands of New Yorkers. “We all know that stop-and-frisk targeted Black and Latino communities in New York, but that goes beyond who police chose to stop,” explains Lenehan. “Police were also more likely to use physical force when they stopped people of color than when they stopped white people.” Data graphic showing the numbers of Blacks/Latinos, Whites and people of other races and ethnicities stopped by the New York City Police in 2011, along with whether they were also frisked and whether force was used. Blacks and Latinos are dispropionately stopped, frisked and have forced used against them.

In 2011, the NYPD stopped Black and Latino people nearly 575,000 times and used physical force against them almost 130,000 times. That’s 84% of all stops and 88% of all force used in stops that year. Yet despite President Trump’s mistaken perception that “it was so incredible, the way it worked,” only a small number of weapons were seized in these stops – mostly knives. Police found weapons in only 1% of stops of Black and Latino residents, but found weapons nearly twice as often when they stopped Whites. As the new report argues, stop-and-frisk succeeds only in alienating vast numbers of city residents from the police, and ultimately creates more problems for public safety.

The report features an innovative data visualization that layers each successive level of police encounters – stops, frisks, and use of force – to show racial discrimination impacts decisions more serious than simple stops. The graphic is drawn to scale (a tiny square is equivalent to 100 New Yorkers) to illustrate the massive impact of stop-and-frisk on the street. According to Lenehan, “With roughly almost 2,000 stops per day, concentrated in Black and Latino communities, stop-and-frisk gave hundreds of thousands of people of color reason to distrust the police.”

The non-profit non-partisan Prison Policy Initiative was founded in 2001 to expose the broader harm of mass criminalization and spark advocacy campaigns to create a more just society. The organization produces big-picture data publications like Mass Incarceration: The Whole Pie to help people fully engage in criminal justice reform. The author, Rose Lenehan, is a PhD candidate at MIT and a member of the Prison Policy Initiative’s Young Professional Network.

The new report is available at https://www.prisonpolicy.org/reports/stopandfrisk.html

-30-


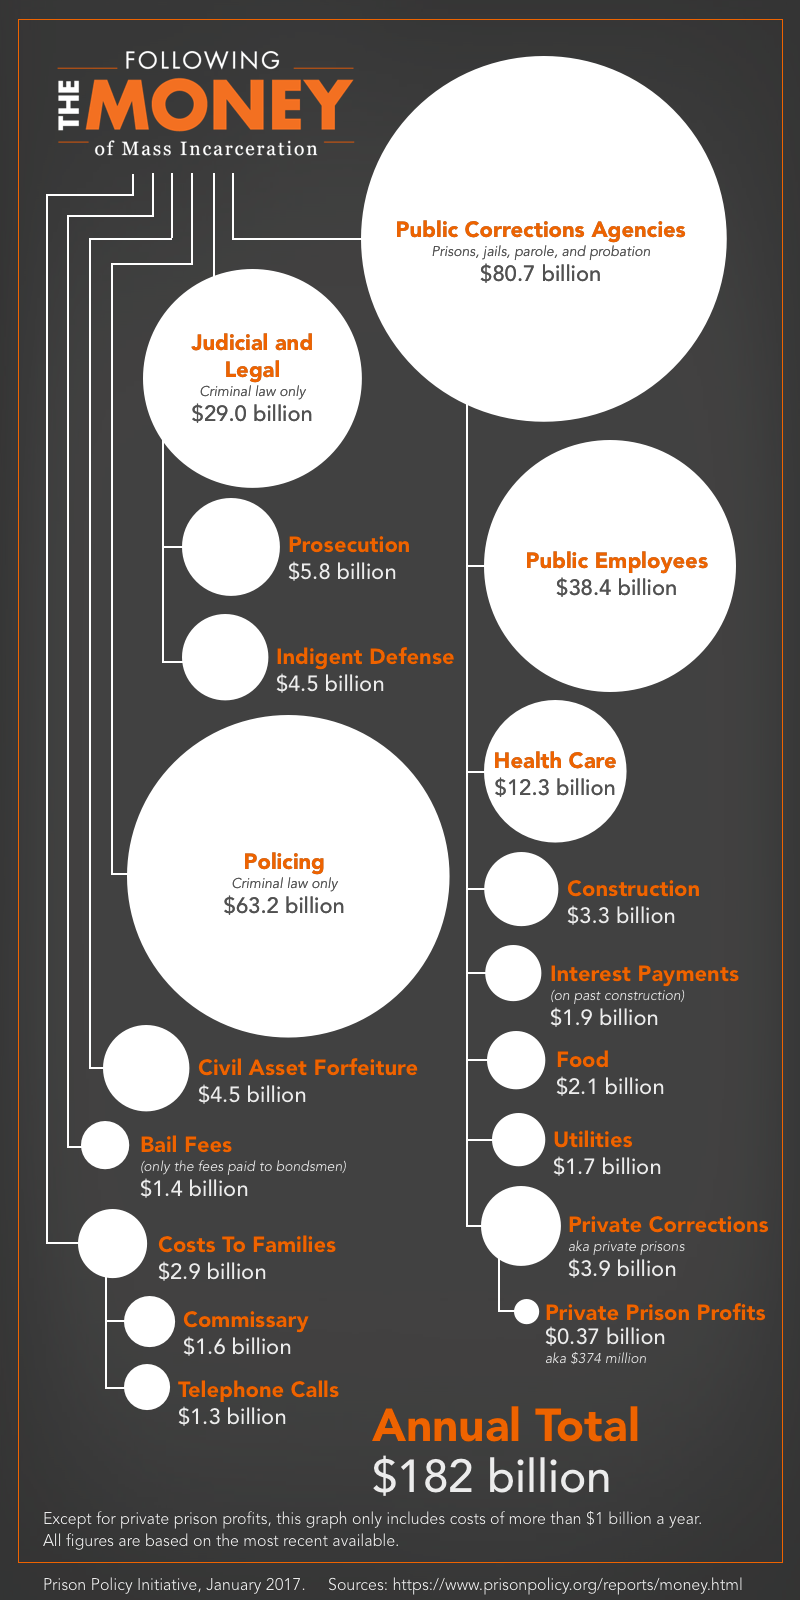
Since the 1980's crime has fallen, but the number of people in jails tripled. Our new report finds two troubling explanations for why this has occurred: the rise in pre-trial detention and the renting of jail space to other authorities.

May 31, 2017

Contact:
Joshua Aiken
jaiken [at] prisonpolicy.org
(413) 527-0845

Easthampton, Mass. — State capitols share responsibility for growing jail populations, charges a new report by the Prison Policy Initiative. “Jails are ostensibly locally controlled, but the people held there are generally accused of violating state law, and all too often, state policymakers ignore jails,” argues the new report, Era of Mass Expansion: Why State Officials Should Fight Jail Growth.

The fact that jails are smaller than state prison systems and under local control has allowed state officials to avoid addressing the problems arising from jail policies and practices. “Reducing the number of people jailed has obvious benefits for individuals, but also helps states curb prison growth down the line,” says Joshua Aiken, report author and Policy Fellow at the Prison Policy Initiative.

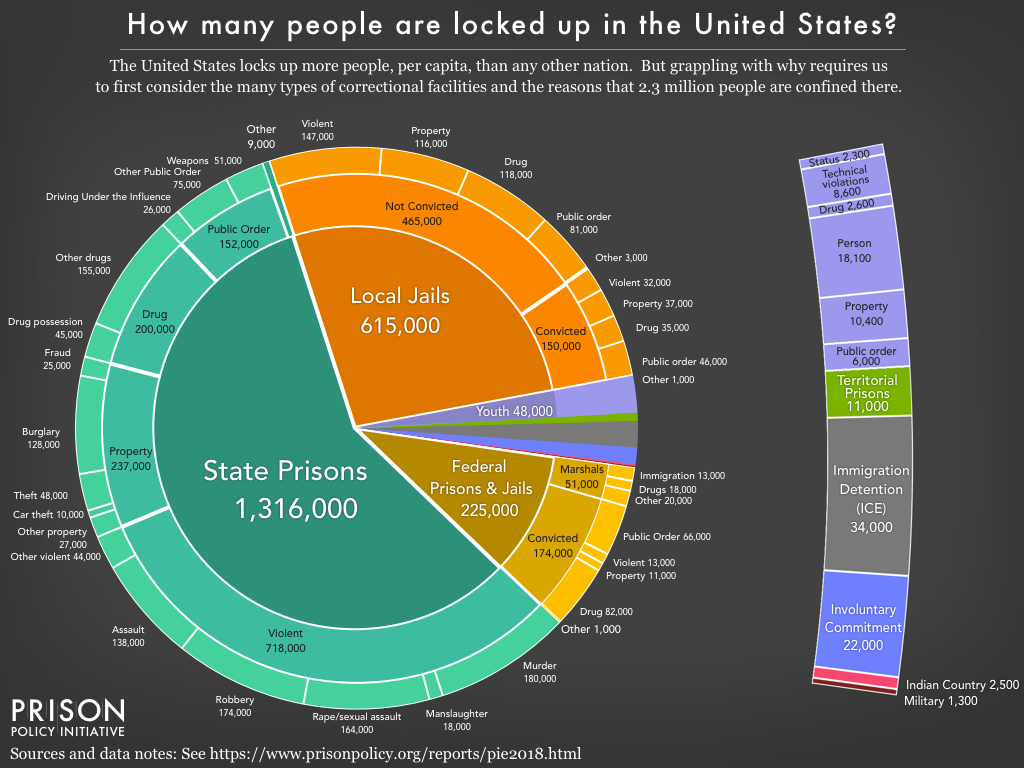
Every year, 11 million people churn through local jail systems, mostly for minor violations of state law. Of the 720,000 people in jails on a given day, most have not been convicted of a crime and have either just been arrested or are too poor to make bail. And since the 1980s, crime has fallen but the number of people jailed has more than tripled.

The new report finds that the key driver of jail growth is not what one might expect – courtroom judges finding more people guilty and sentencing them to jail. In fact, the number of people serving jail sentences has actually fallen over the last 20 years. Instead, the report finds two troubling explanations for jail growth:
graph showing that for the 30 year period from 1983-2013, the driving force of jail expansion has been the rise in pre-trial detention and the renting of jail space to other authorities

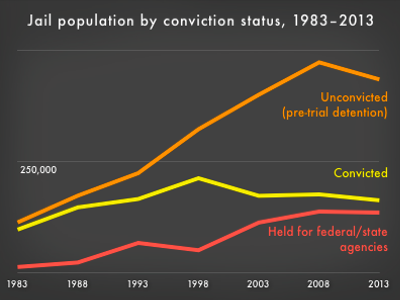
  • An increasing number of people held pre-trial.
  • Growing demand from federal and state agencies to rent cell space from local jails.

Recognizing the importance of state-specific data for policymakers and advocates, the report offers more than a hundred graphs that make possible state comparisons of jail trends. The report uncovers unique state problems that drive mass incarceration:

  • In some states, state officials have not utilized their ability to regulate the commercial bail industry, which has profited from the increased reliance on money bail and increased bail amounts. These trends have expanded the pre-trial population dramatically over time.
  • In other states, state lawmakers have expanded criminal codes, enabled overzealous prosecutors, and allowed police practices to play a paramount role in driving up jail populations, while underfunding pre-trial programs and alternatives to incarceration.
  • In 25 states, 10% or more of the people confined in local jails are being held for state or federal agencies, with some counties even adding capacity to meet the demand. This report is the first to be able to address the local jail population separately from the troubling issue of renting jail space.

Era of Mass Expansion draws particular attention to the states where the dubious practice of renting jail space to other authorities contributes most to jail growth. “Local sheriffs, especially in states like Louisiana and Kentucky, end up running a side business of incarcerating people for the state prison system or immigration authorities,” explains Aiken. “Renting out jail space often creates a financial incentive to expand jail facilities and keep more people behind bars.” The report finds that renting jail space for profit has contributed more to national jail growth since the 1980s than people who are being held by local authorities and who have actually been convicted of crimes.

For state policymakers, the report offers 10 specific recommendations to change how offenses are classified and treated by law enforcement, eliminate policies that criminalize poverty or create financial incentives for unnecessarily punitive practices, and monitor the upstream effects of local discretion. “There are plenty of things local officials can do to lower the jail population,” says Aiken. “With this report, I wanted to bring in state-level actors by showing how much of the solution is in their hands.”

The non-profit non-partisan Prison Policy Initiative was founded in 2001 to expose the broader harm of mass criminalization and spark advocacy campaigns to create a more just society. The organization produces big-picture data publications like Mass Incarceration: The Whole Pie to help people fully engage in criminal justice reform. Era of Mass Expansion builds upon the organization’s 2016 analysis of the cycle of poverty and jail incarceration, Detaining the Poor: How money bail perpetuates an endless cycle of poverty and jail time.

The new report is available at www.prisonpolicy.org/reports/jailsovertime.html.


With this year’s updated edition of Mass Incarceration: The Whole Pie, we once again answer the essential questions of how many people are locked up, where, and why.

March 14, 2017

Are there 1.3 million people behind bars in the U.S., or is it actually closer to 2.3 million? How important are probation and parole when we think about the scope of the criminal justice system? In 2014, the Prison Policy Initiative first aggregated data on the country’s fragmented systems of confinement. With this year’s updated edition of Mass Incarceration: The Whole Pie, we once again answer the essential questions of how many people are locked up, where, and why.

Pie chart showing the number of people locked up on a given day in the United States by facility type and the underlying offense using the newest data available in March 2017.

The publication of the new report, with 15 new data visuals, comes at a critical moment. The new administration has taken aim at the past decade’s advances toward criminal justice reform, and has a troubling reliance on “alternative facts” to support its agenda. The Whole Pie 2017 brings together the most current government data available to provide policymakers and the public a clear and accurate big picture view of punishment in the U.S.

The 2017 report shows that mass incarceration is not a single monolithic system. Instead, we have a federal system, 50 state systems, and thousands of local government systems. The byzantine structure of justice systems means the policymaking is equally complex and changes must be made at each level. While the White House is moving away from criminal justice reform, The Whole Pie offers the reassuring reminder that the bulk of incarceration flows directly from the policy choices made by state and local — not federal — governments.

Other surprising findings include:

  • 99% of jail growth over the past 15 years was in the detention of people who are presumed innocent.
  • While law enforcement continues to arrest more than 1 million people each year for drug possession, the numbers in The Whole Pie show that ending mass incarceration will require rethinking not just the war on drugs, but also our society’s response to violent crimes.
  • The juvenile justice system locks up 7,200 youth whose “most serious offense” is not even a crime. 6,600 children are locked up for “technical violations” of their probation, and 600 for “status” offenses which are “behaviors that are not law violations for adults, such as running away, truancy, and incorrigibility.”
  • 57,000 people are locked up for criminal or civil immigration offenses, and ICE detention numbers are growing.

The United States locks up more people than any other country, at a rate more than five times higher than most other nations. One impediment to reform is the lack of available data to guide that conversation. In The Whole Pie, the Prison Policy Initiative provides the comprehensive view of mass incarceration that society needs in order to plot a path forward.

The non-profit non-partisan Prison Policy Initiative was founded in 2001 to expose the broader harm of mass criminalization and spark advocacy campaigns to create a more just society. The organization leads the nation’s fight to keep the prison system from exerting undue influence on the political process (a.k.a. prison gerrymandering) and plays a leading role in protecting the families of incarcerated people from the predatory prison and jail telephone industry and the video visitation industry.

Mass Incarceration: The Whole Pie, an annual report released each year on Pi Day, is a part of the organization’s National Incarceration Briefing Series. Recent reports in that series include Following the Money of Mass Incarceration, which aggregates economic data to offer a big picture view of who pays for and who benefits from mass incarceration, and Detaining the Poor: How money bail perpetuates an endless cycle of poverty and jail time, finding that the ability to pay money bail is impossible for too many defendants because it represents eight months of a typical defendant’s income.

The report is available at: https://www.prisonpolicy.org/reports/pie2017.html

-30-


In a first-of-its-kind report, the Prison Policy Initiative aggregates economic data to offer a big picture view of who pays for and who benefits from mass incarceration.

January 25, 2017

In a first-of-its-kind report, the Prison Policy Initiative aggregates economic data to offer a big picture view of who pays for and who benefits from mass incarceration.

Graph showing the $182 billion system of mass incarceration and the relative size of its sub-parts from policing, to courts to private companies. Private prisons are a very small part of the total.

The report, Following the Money of Mass Incarceration, and infographic are a first step toward better understanding who benefits from mass incarceration and who might be resistant to reform.

In the report, the Prison Policy Initiative:

  • provides the significant costs of our globally unprecedented system of mass incarceration and over-criminalization,
  • gives the relative importance of the various parts,
  • highlights some of the under-discussed yet costly parts of the system, and then
  • shares all of its sources so that journalists and advocates can build upon its work.

Following the Money of Mass Incarceration establishes that:

  • Almost half of the money spent on running the correctional system goes to paying staff. This group is an influential lobby that sometimes prevents reform and whose influence is often protected even when prison populations drop.
  • Private companies that supply goods to the prison commissary or provide telephone service for correctional facilities bring in almost as much money ($2.9 billion) as governments pay private companies ($3.9 billion) to operate private prisons.
  • Commissary vendors that sell goods to incarcerated people — who rely largely on money sent by loved ones — is itself a large industry that brings in $1.6 billion a year.

Following the Money of Mass Incarceration finds that mass incarceration and over-criminalization are deeply embedded in our economy,” said report co-author and Prison Policy Initiative Executive Director Peter Wagner. “Changing our nation’s criminal justice priorities is going to require challenging a lot of entrenched but often hidden interests.”

The report is available at: https://www.prisonpolicy.org/reports/money.html.


Stay Informed


Get the latest updates:


Share on 𝕏 Donate