Police disproportionately target Black and other marginalized people in stops, arrests, and use of force; and are increasingly called upon to respond to problems, such as homelessness, that are unrelated to public safety.
by Wendy Sawyer,
June 5, 2020
Many of the worst features of mass incarceration — such as racial disparities in prisons — can be traced back to policing. Our research on the policies that impact justice-involved and incarcerated people therefore often intersects with policing issues. Now, at a time when police practices, budgets, and roles in society are at the center of the national conversation about criminal justice, we have compiled our key work related to policing (and our discussions of other researchers’ work) in one briefing.
1. Nearly 1 million people in the U.S. experience the threat or use of force by police annually, and they are disproportionately Black and Latinx.
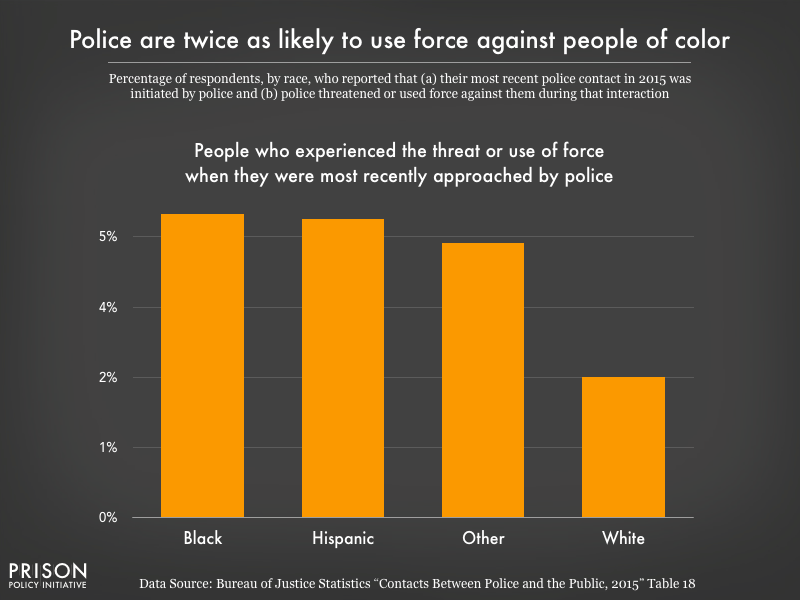 The scale of police use of force is an important fact in and of itself, made more troubling by the racial disparities evident in police stops and use of force. In a national survey, Black respondents were more likely to be stopped by police than white or Latinx respondents, and both Black and Latinx respondents were more likely to be stopped multiple times over the course of a year than white respondents. The survey also showed that when they initiated a stop, police were twice as likely to threaten or use force against Black and Latinx respondents than whites. These disparate experiences have predictable effects on public trust in police: white respondents were more likely to view police use of force as legitimate and more likely to seek help from police than were people of color.
2. Over 4.9 million people are arrested each year.
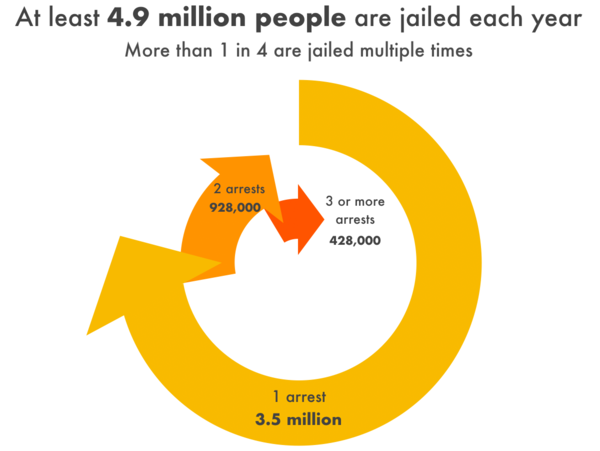 In all, there are over 10 million arrests in the U.S. each year, but many people are arrested multiple times per year. From responses to a national survey, we estimate that at least 4.9 million unique individuals are arrested and jailed each year, and at least one in four of those individuals are arrested more than once in the same year. The massive scale of these police responses means that there are millions of opportunities each year for police-civilian encounters to turn violent or fatal, and an estimated 77 million people are now saddled with a criminal record.
3. Most policing has little to do with real threats to public safety: the vast majority of arrests are for low-level offenses. Only 5% of all arrests are for serious violent offenses.
The “massive misdemeanor system” in the U.S. is an important but overlooked contributor to overcriminalization and mass incarceration. For behaviors as benign as jaywalking, sitting on a sidewalk, or petty theft, an estimated 13 million misdemeanor charges sweep droves of Americans into the criminal justice system each year (and that’s excluding civil violations and speeding). And while misdemeanor charges may sound like small potatoes, they carry serious financial, personal, and social costs, especially for defendants but also for broader society, which finances the enforcement of these minor violations, the processing of these court cases, and all of the unnecessary incarceration that comes with them.
4. Policing criminal law violations costs taxpayers over $63 billion each year.
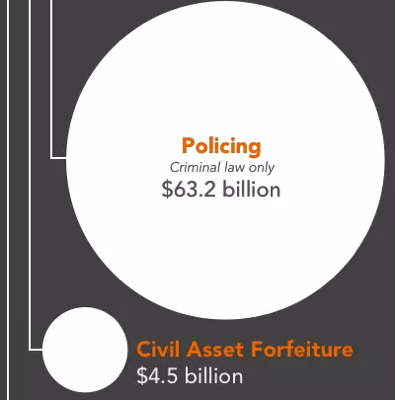 Policing costs the public $126.4 billion per year, nationwide. In our report about the fiscal costs of mass incarceration to the government and families of justice-involved people, we used only half of that figure – $63.2 billion – because only about half of police work is devoted to criminal law enforcement. The other half is spent on things unrelated to criminal law violations, such as traffic control, responding to civil disputes, and administration. Even at half the total cost of policing, $63.2 billion represents a huge public investment in criminalization. As many Americans are questioning the role of police in society, they should know just how much money is available to redirect to more humane community-based responses to social problems.
5. People who are Black and/or poor are more likely to be arrested, and to be arrested repeatedly.
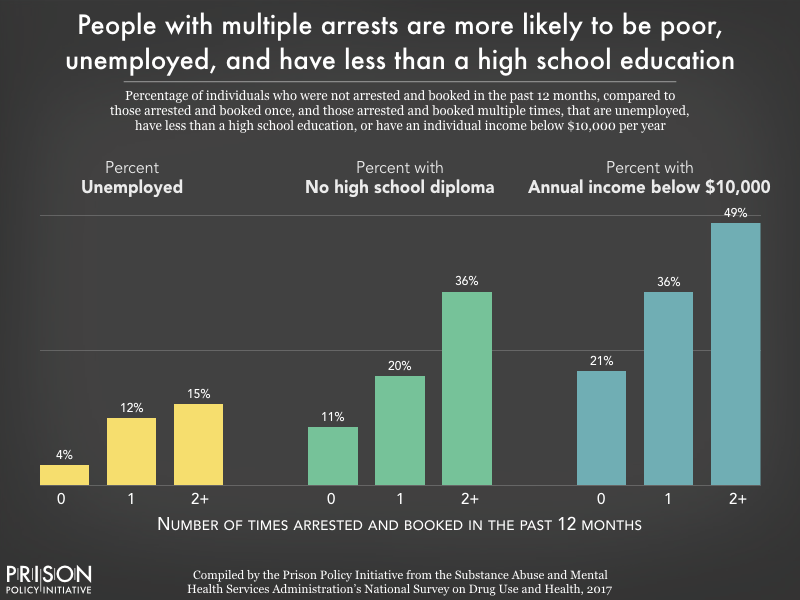 People who are arrested and jailed are often among the most socially and economically marginalized in society. The overrepresentation of Black men and women among people who are arrested is largely reflective of persistent residential segregation and racial profiling, which subject Black individuals and communities to greater surveillance and increased likelihood of police stops and searches. Poverty, unemployment, and educational exclusion are also factors strongly correlated with likelihood of arrest.
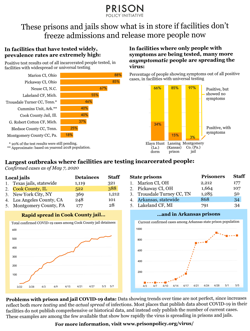
6. People with mental illnesses or substance use disorders are also more likely to be arrested, and to be arrested repeatedly.
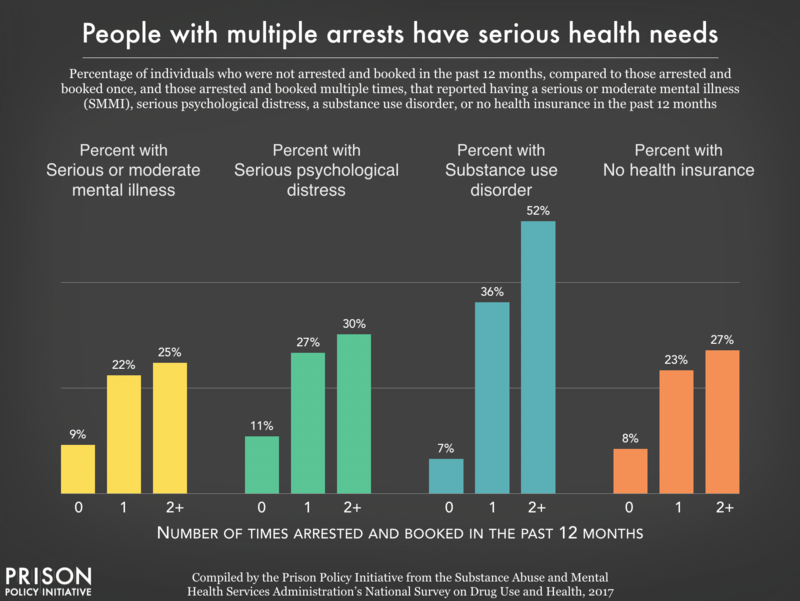 People who are arrested often have serious health needs that cannot and should not be addressed through policing or incarceration. Even a few days in jail can be devastating for people with serious mental health and medical needs, as they are cut off from their medications, support systems, and regular healthcare providers. Even worse, many people are arrested in the midst of a health crisis, such as mental distress or substance use withdrawal. History has shown that jails are unable to provide effective mental health and medical care to incarcerated people, and too often, jailing people with serious health problems has lethal consequences.
7. Women make up a growing share of arrests and report much more use of force than they did 20 years ago, with Black women most likely to be targeted.
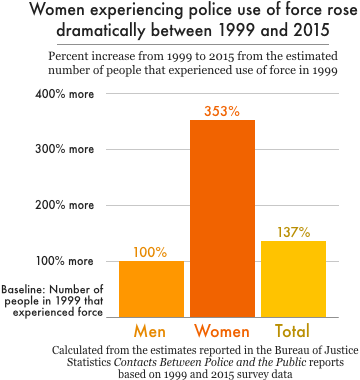 The experiences of women and girls – especially Black women and other women of color – are often lost in the national conversation about policing. But of course women, too, are subject to racial profiling, use of excessive force, and any number of violations of their rights and dignity by police. Our analysis of national data shows that women now make up over a quarter of all arrests, with an estimated 2.8 million arrests in 2018. At the same time, the use of force has become much more common among women: the number of women who experienced police use of force (about 250,000) was 3.5 times greater in 2015 compared to 1999.
A closer examination of the data also reveals racial disparities in police stops, arrests, and use of force involving women. Black women are more likely than white or Latina women to be stopped while driving, and Black women are arrested 3 times as often as white women and twice as often as Latinas during police stops. Black women also report experiencing police use of force at higher rates than white or Latina women. With an estimated 12 million women per year experiencing police-initiated encounters – many of which involve searches, use of force, and other traumatizing experiences – the harms of policing to women demand more attention.
8. Disabled people represent a disproportionate number of those stopped, arrested, and killed by police.
As the ACLU of Southern California and the Bazelon Center for Mental Health Law report, many criminalized behaviors targeted by law enforcement are related to disability: substance use (often used as self-medication for pain and other symptoms), homelessness (an estimated 78% of people in shelters have a disability), and atypical reactions to social cues, which may be interpreted as vaguely defined crimes such as “disorderly conduct.” The Ruderman Foundation reports that in police use-of-force incidents, the media and police often blame disabled people for their own victimization, especially by characterizing disabled people of color as “threatening” and “refusing to comply.”
The frequent use of police as first responders to individuals in crisis only compounds these problems. Too often, officers who are called to help individuals get medical treatment end up shooting them instead. Public funds should be redirected to community health providers to handle mental and physical health crises, rather than trying to meet this critical need with militarized police forces, who sometimes receive little training on crisis response or de-escalation.
9. Police treat Black Americans with less respect.
A Stanford University analysis of police bodycam footage from nearly 1,000 vehicle stops substantiates what Black Americans already know: police officers treat Black people differently than they do whites. This study, discussed in our briefing, finds that “police officers speak significantly less respectfully to black than to white community members in everyday traffic stops,” and that this happens irrespective of officer race, severity of the infraction, and outcome of the stop. These findings lend important context to the racial disparities observed in police encounters.
10. State and federal law enforcement practices target poor Black and Latinx residents.
Separate reports focusing on policing in Chicago highlighted two law enforcement strategies justified as ways to protect communities – drug stings and asset forfeiture – that facilitate widespread targeting of low-income communities of color. Federal agents from the Bureau of Alcohol, Tobacco, Firearms, and Explosives (ATF) arranged drug stings that set up fake drug stash houses and lured people into committing new crimes. But they didn’t single out just anyone: At least 91% of the time, agents targeted Black and Latinx people. Columbia professor Jeffrey Fagan’s analysis found no statistical explanation for this except disparate racial treatment. A District Court judge described these cases as “ensnaring chronically unemployed individuals from poverty-ridden areas.”
Meanwhile, Cook County police conducted 23,000 seizures of assets connected to civil and criminal cases, a practice that is supposed to disrupt major illegal drug trades. But an analysis by Reason and the Lucy Parsons Lab showed that police officers were often taking petty property and the lowest-value seizures (valued under $100) were clustered in predominantly poor and Black communities on Chicago’s South and West Sides. These examples illustrate that at every level, the “war on drugs” functions as a war on communities of color.
For more information, the reports and briefings summarized here – and more – can be found on our Policing Issue page.
Acknowledgements: This briefing was compiled by Wendy Sawyer based on previously published writing by current staffers Wanda Bertram, Alexi Jones, Wendy Sawyer, and by Policy Initiative alumns Joshua Aiken, Alex Clark, Lucius Couloute, and Elliot Oberholtzer.