March 19, 2025: Join Prison Policy Initiative’s Advocacy Department at 1 PM EST on Wednesday, March 19, 2025, for a webinar about understanding recidivism. We will cover strategies from our recidivism toolkit, including an overview of recidivism statistics and what they really mean, how to combat the “Willie Horton” effect, and ways that advocates can transform the narrative around reentry to make it less focused on negative outcomes and more focused on the ways that returning citizens contribute to their communities.
Each state sets a statutory definition of which thefts are felonies (punishable by longer sentences in prison) and which are misdemeanors (punishable by shorter sentences in jail). But in many states, the dollar amount separating felony theft from misdemeanor theft has not been increased in years, even though inflation makes the older laws more punitive each year.
These limits vary from New Jersey (a $200 theft is a fourth-degree felony) to Texas and Wisconsin where a theft must be worth $2,500 before you can get a state prison sentence. New Jersey’s limit is so low because it is one of the oldest in the country — it remains unchanged from when it was originally enacted in 1978.1 Only one state — Alaska — automatically adjusts the felony theft threshold with inflation.2 The range between the states is tremendous:
Table showing felony theft thresholds in each state as of 2018. For more detail including the amount of the previous threshold for most states, see the appendix table below. *The exact year of the last update to the felony theft threshold in each state was not readily available for all states, but Pew Charitable Trusts’ 2018 article reports that that the felony theft threshold in these states predate the year 2000.
State
Felony Theft Threshold
Year Threshold Last Updated
Alabama
$1,500
2015
Alaska
$1,000
2016
Arizona
$1,000
2006
Arkansas
$1,000
2011
California
$950
2010
Colorado
$2,000
2013
Connecticut
$2,000
2009
Delaware
$1,500
2009
District of Columbia
$1,000
2010
Florida
$750
2019
Georgia
$1,500
2012
Hawaii
$750
2016
Idaho
$1,000
before 2000*
Illinois
$500
2010
Indiana
$750
2013
Iowa
$1,000
before 2000*
Kansas
$1,500
2016
Kentucky
$500
2009
Louisiana
$1,000
2017
Maine
$1,000
before 2000*
Maryland
$1,500
2016
Massachusetts
$1,200
2018
Michigan
$1,000
before 2000*
Minnesota
$1,000
2007
Mississippi
$1,000
2014
Missouri
$750
2014
Montana
$1,500
2009
Nebraska
$1,500
2015
Nevada
$650
2011
New Hampshire
$1,000
2010
New Jersey
$200
1978
New Mexico
$500
2006
New York
$1,000
before 2000*
North Carolina
$1,000
before 2000*
North Dakota
$1,000
2013
Ohio
$1,000
2011
Oklahoma
$1,000
2016
Oregon
$1,000
2009
Pennsylvania
$2,000
before 2000*
Rhode Island
$1,500
2012
South Carolina
$2,000
2010
South Dakota
$1,000
2005
Tennessee
$1,000
2016
Texas
$2,500
2015
Utah
$1,500
2010
Vermont
$900
2006
Virginia
$1,000
2020
Washington
$750
2009
West Virginia
$1,000
before 2000*
Wisconsin
$2,500
2001
Wyoming
$1,000
2004
Updating felony theft statutes is one simple way to reduce the number of people serving time in prison for low-level offenses. Making more minor thefts into misdemeanors will also spare more people from the often lifelong collateral consequences of felony convictions that can limit their access to public housing, welfare benefits, and even voting.
Decreasing the punishment for minor thefts is unlikely to encourage more thefts. As Pew Charitable Trusts found in their invaluable 2018 report, States Can Safely Raise Their Felony Theft Thresholds, Research Shows, South Carolina’s property crime rates actually continued to fall years after the threshold increased. This isn’t unique to South Carolina, either. Pew’s article also included a brief comparison of crime rates in all 50 states, reporting that between 2000 and 2012, the 30 states that increased their thresholds had property crime rates similar to the 20 states that had not yet updated their laws.
Footnotes
See New Jersey Statute 2C:20-3 (Chapter 95, Laws of 1978) ↩
This table was built from The Effects of Changing Felony Theft Thresholds (2017) and States Can Safely Raise Their Felony Theft Thresholds, Research Shows (2018) by Pew Charitable Trusts and supplemented with additional research by the Prison Policy Initiative for Florida and Virginia which changed their laws after Pews’ reports, as well as New Jersey and Wisconsin, for which we found the year the threshold was last updated. *The exact year of the last update to the felony theft threshold in each state was not readily available for all states, but Pew Charitable Trusts’ 2018 article reports that that the felony theft threshold in these states predate the year 2000.
There is no question that the number of police killings of civilians in the U.S. – who are disproportionately Black and other people of color – are the result of policies and practices that enable and even encourage police violence. Compared to police in other wealthy democracies, American police kill civilians at incredibly high rates:
The chart above compares the annual rates of police killings in each country, accounting for differences in population size. This is the most apples-to-apples comparison we can make with this data.1 But the total number of deaths at the hands of police is also worth seeing in comparison with other countries:
The sources for these charts are listed in the table below. For more statistics on police, arrests, and incarceration in the United States, see these other pages:
National Deaths in Custody Program, Deaths in custody in Australia 2017-18. This includes deaths that occurred in police custody and custody-related operations (i.e. motor vehicle pursuit deaths).
UK Office for National Statistics, Estimates of the population for the UK, England and Wales, Scotland and Northern Ireland (see link to Excel file; we used mid-2019 population estimate for England and Wales only)
The World Bank, population data (2018 population estimate)
Footnotes
The data here reflect the number of police killings of civilians reported in each country. They do not account for the manner of death, as that data was not available for every country. The rates account for population only; they do not reflect differences in police-public contact rates nor the rate of gun ownership in each country, nor any other point of comparison that might partially explain these differences. The statistics presented here can only illuminate the vast differences between policing in the U.S. and in other wealthy nations, not explain them. ↩
Police disproportionately target Black and other marginalized people in stops, arrests, and use of force; and are increasingly called upon to respond to problems, such as homelessness, that are unrelated to public safety.
Police disproportionately target Black and other marginalized people in stops, arrests, and use of force; and are increasingly called upon to respond to problems, such as homelessness, that are unrelated to public safety.
Many of the worst features of mass incarceration — such as racial disparities in prisons — can be traced back to policing. Our research on the policies that impact justice-involved and incarcerated people therefore often intersects with policing issues. Now, at a time when police practices, budgets, and roles in society are at the center of the national conversation about criminal justice, we have compiled our key work related to policing (and our discussions of other researchers’ work) in one briefing.
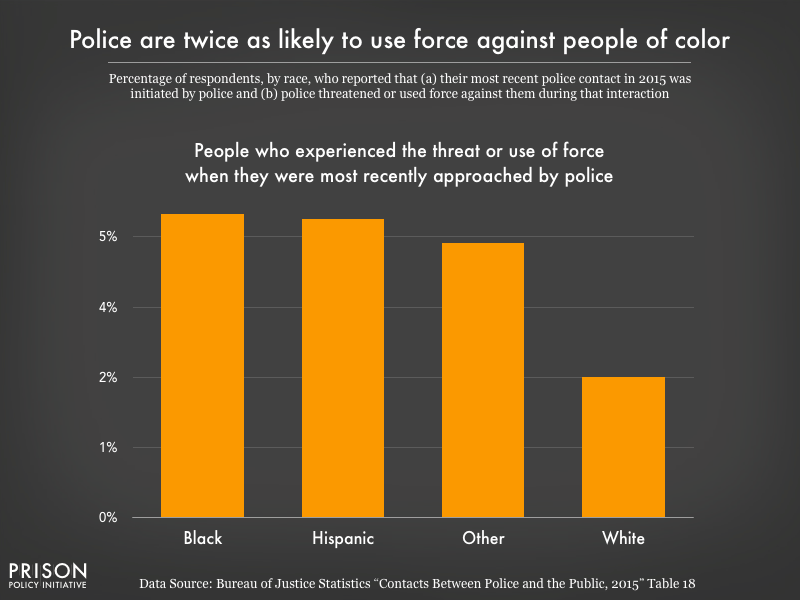
The scale of police use of force is an important fact in and of itself, made more troubling by the racial disparities evident in police stops and use of force. In a national survey, Black respondents were more likely to be stopped by police than white or Latinx respondents, and both Black and Latinx respondents were more likely to be stopped multiple times over the course of a year than white respondents. The survey also showed that when they initiated a stop, police were twice as likely to threaten or use force against Black and Latinx respondents than whites. These disparate experiences have predictable effects on public trust in police: white respondents were more likely to view police use of force as legitimate and more likely to seek help from police than were people of color.
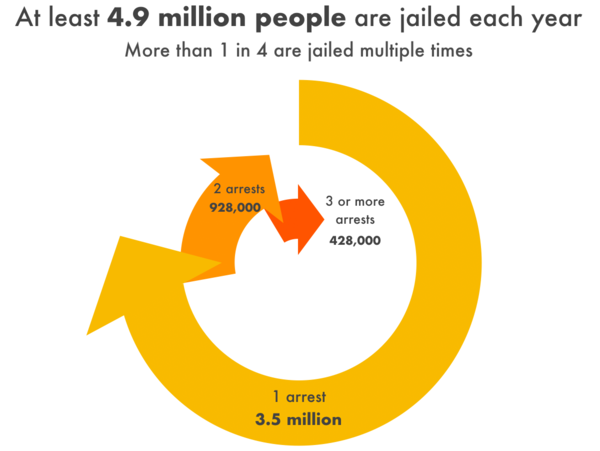
In all, there are over 10 million arrests in the U.S. each year, but many people are arrested multiple times per year. From responses to a national survey, we estimate that at least 4.9 million unique individuals are arrested and jailed each year, and at least one in four of those individuals are arrested more than once in the same year. The massive scale of these police responses means that there are millions of opportunities each year for police-civilian encounters to turn violent or fatal, and an estimated 77 million people are now saddled with a criminal record.
The “massive misdemeanor system” in the U.S. is an important but overlooked contributor to overcriminalization and mass incarceration. For behaviors as benign as jaywalking, sitting on a sidewalk, or petty theft, an estimated 13 million misdemeanor charges sweep droves of Americans into the criminal justice system each year (and that’s excluding civil violations and speeding). And while misdemeanor charges may sound like small potatoes, they carry serious financial, personal, and social costs, especially for defendants but also for broader society, which finances the enforcement of these minor violations, the processing of these court cases, and all of the unnecessary incarceration that comes with them.
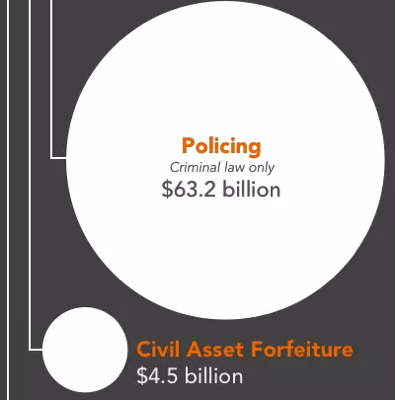
Policing costs the public $126.4 billion per year, nationwide. In our report about the fiscal costs of mass incarceration to the government and families of justice-involved people, we used only half of that figure – $63.2 billion – because only about half of police work is devoted to criminal law enforcement. The other half is spent on things unrelated to criminal law violations, such as traffic control, responding to civil disputes, and administration. Even at half the total cost of policing, $63.2 billion represents a huge public investment in criminalization. As many Americans are questioning the role of police in society, they should know just how much money is available to redirect to more humane community-based responses to social problems.
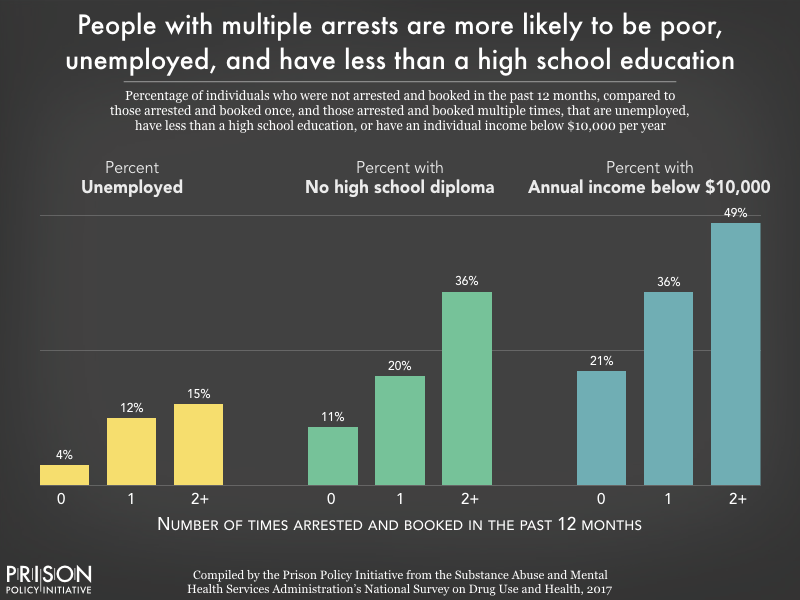
People who are arrested and jailed are often among the most socially and economically marginalized in society. The overrepresentation of Black men and women among people who are arrested is largely reflective of persistent residential segregation and racial profiling, which subject Black individuals and communities to greater surveillance and increased likelihood of police stops and searches. Poverty, unemployment, and educational exclusion are also factors strongly correlated with likelihood of arrest.
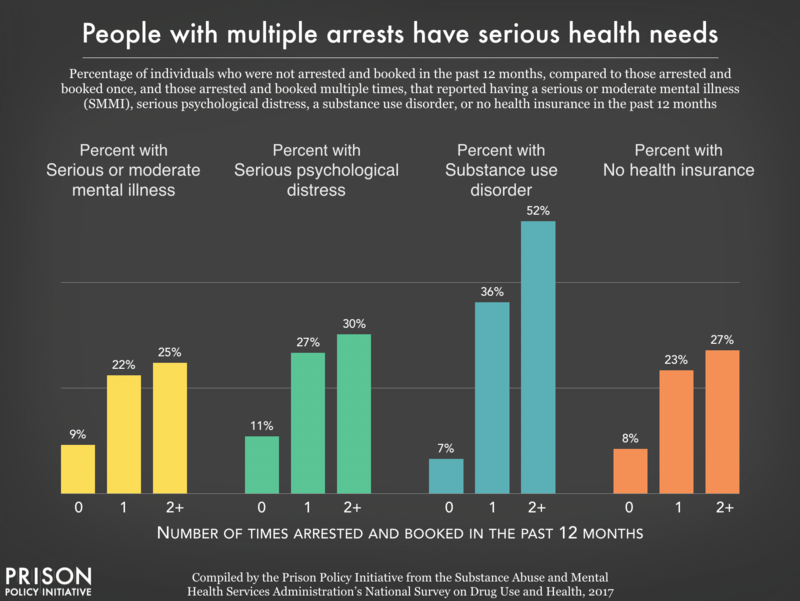
People who are arrested often have serious health needs that cannot and should not be addressed through policing or incarceration. Even a few days in jail can be devastating for people with serious mental health and medical needs, as they are cut off from their medications, support systems, and regular healthcare providers. Even worse, many people are arrested in the midst of a health crisis, such as mental distress or substance use withdrawal. History has shown that jails are unable to provide effective mental health and medical care to incarcerated people, and too often, jailing people with serious health problems has lethal consequences.
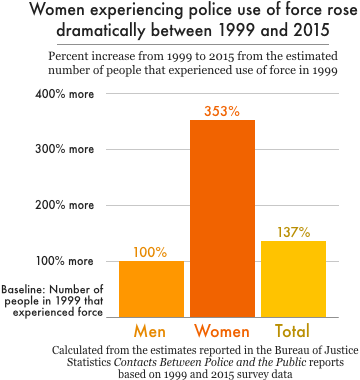
The experiences of women and girls – especially Black women and other women of color – are often lost in the national conversation about policing. But of course women, too, are subject to racial profiling, use of excessive force, and any number of violations of their rights and dignity by police. Our analysis of national data shows that women now make up over a quarter of all arrests, with an estimated 2.8 million arrests in 2018. At the same time, the use of force has become much more common among women: the number of women who experienced police use of force (about 250,000) was 3.5 times greater in 2015 compared to 1999.
A closer examination of the data also reveals racial disparities in police stops, arrests, and use of force involving women. Black women are more likely than white or Latina women to be stopped while driving, and Black women are arrested 3 times as often as white women and twice as often as Latinas during police stops. Black women also report experiencing police use of force at higher rates than white or Latina women. With an estimated 12 million women per year experiencing police-initiated encounters – many of which involve searches, use of force, and other traumatizing experiences – the harms of policing to women demand more attention.
As the ACLU of Southern California and the Bazelon Center for Mental Health Law report, many criminalized behaviors targeted by law enforcement are related to disability: substance use (often used as self-medication for pain and other symptoms), homelessness (an estimated 78% of people in shelters have a disability), and atypical reactions to social cues, which may be interpreted as vaguely defined crimes such as “disorderly conduct.” The Ruderman Foundation reports that in police use-of-force incidents, the media and police often blame disabled people for their own victimization, especially by characterizing disabled people of color as “threatening” and “refusing to comply.”
The frequent use of police as first responders to individuals in crisis only compounds these problems. Too often, officers who are called to help individuals get medical treatment end up shooting them instead. Public funds should be redirected to community health providers to handle mental and physical health crises, rather than trying to meet this critical need with militarized police forces, who sometimes receive little training on crisis response or de-escalation.
A Stanford University analysis of police bodycam footage from nearly 1,000 vehicle stops substantiates what Black Americans already know: police officers treat Black people differently than they do whites. This study, discussed in our briefing, finds that “police officers speak significantly less respectfully to black than to white community members in everyday traffic stops,” and that this happens irrespective of officer race, severity of the infraction, and outcome of the stop. These findings lend important context to the racial disparities observed in police encounters.
Separate reports focusing on policing in Chicago highlighted two law enforcement strategies justified as ways to protect communities – drug stings and asset forfeiture – that facilitate widespread targeting of low-income communities of color. Federal agents from the Bureau of Alcohol, Tobacco, Firearms, and Explosives (ATF) arranged drug stings that set up fake drug stash houses and lured people into committing new crimes. But they didn’t single out just anyone: At least 91% of the time, agents targeted Black and Latinx people. Columbia professor Jeffrey Fagan’s analysis found no statistical explanation for this except disparate racial treatment. A District Court judge described these cases as “ensnaring chronically unemployed individuals from poverty-ridden areas.”
Meanwhile, Cook County police conducted 23,000 seizures of assets connected to civil and criminal cases, a practice that is supposed to disrupt major illegal drug trades. But an analysis by Reason and the Lucy Parsons Lab showed that police officers were often taking petty property and the lowest-value seizures (valued under $100) were clustered in predominantly poor and Black communities on Chicago’s South and West Sides. These examples illustrate that at every level, the “war on drugs” functions as a war on communities of color.
For more information, the reports and briefings summarized here – and more – can be found on our Policing Issue page.
Acknowledgements: This briefing was compiled by Wendy Sawyer based on previously published writing by current staffers Wanda Bertram, Alexi Jones, Wendy Sawyer, and by Policy Initiative alumns Joshua Aiken, Alex Clark, Lucius Couloute, and Elliot Oberholtzer.
With the coronavirus pandemic threatening to turn prison sentences into death sentences, many incarcerated people are seeking compassionate release — the release of people who are facing imminent death and who pose no threat to the public — to save them from dying of COVID-19 in prison. Unfortunately, what they, and the American public, are learning is that compassionate release is not a transparent and linear process, but an unpredictably ordered series of obstacles. As artist Kevin Pyle depicts here, these hurdles and delays kill the vast majority of compassionate release petitions:
Applying for compassionate release is a lengthy and cumbersome process. Given that those who apply are almost always terminally ill or profoundly incapacitated, the arbitrary nature of this process means many die before their cases are resolved.1
The compassionate release process varies tremendously between states (some states even give it a different name, like “medical parole,” “geriatric parole”, etc.),2 but the basic framework is the same: An incarcerated person is recommended3 for release on compassionate grounds to prison administrators, who then solicit a medical recommendation, and then administrators or members of the parole board approve or deny compassionate release. Some states allow only family and attorneys to recommend that someone be released on these grounds; others allow incarcerated individuals to apply on their own behalf, or allow prison personnel to do so.
Compassionate release programs are plagued by many shortcomings, including:
Requirements that a person be extremely close to death, or so incapacitated that they do not understand why they are being punished.4
Requiring medical professionals to attest that someone is within six months, or nine months, of death. Health professionals are reluctant to give such exact prognoses, which means prison officials will default to saying “it’s safer just to not let this person go.”5
Allowing the ultimate decision-makers6 to overrule recommendations from medical professionals and prison staff (e.g. by refuting or ignoring a medical prognosis).
The compassionate release process is frustratingly obscure not only for applicants, but for reporters, advocates, and others trying to understand the system. In their national survey, FAMM found that only three states are required to publish data on compassionate release grants, and eight other states publish some publicly available data, leaving most Americans in the dark about how often compassionate release is actually used. And despite that fact that FAMM has helpful memos for all fifty states and the District of Columbia detailing eligibility requirements for compassionate release, the application and referral process, the necessary documentation and assessments, and the decision-making criteria, the application process remains an arduous one.
There is plenty of room for states to improve their compassionate release processes. In our 2018 report Eight Keys to Mercy, we recommended that states:
Make compassionate release available to all incarcerated people, irrespective of the offenses for which they are incarcerated.
Streamline all compassionate release processes and set reachable deadlines so that petitioners don’t die due to bureaucratic bottlenecks before they are released.
Limit the ability of prison officials to overrule, on medical grounds, a recommendation of release by medical professionals.
But even when a compassionate release system operates efficiently and fairly, the majority of people in prison are still not eligible for it. As currently constituted, these programs exclude too many people and these systems were never designed for quick responses during a global pandemic. States need to look beyond compassionate release — including expedited parole, and mass commutations — to slow the spread of the pandemic and prevent a needless tragedy behind bars.
Footnotes
According to the New York Times, between 2013 and 2017, the federal Bureau of Prisons approved only 6% of the 5,400 compassionate release applications received; meanwhile, 266 other applicants died in prison. Their analysis of federal prison data shows that it takes over six months, on average, for an incarcerated person to receive an answer on their compassionate release application from the BOP. In one tragic example, prison officials denied an application for someone because the BOP put aside prison doctors’ prognosis of less than six months and concluded that he had more than 18 months to live, despite. Two days after receiving the denial, he died. ↩
FAMM’s national survey found that not all states use the term “compassionate release” and instead refer to these programs as medical and geriatric parole, short- and long-term furloughs, suspension or reduction of sentences, and executive clemency on medical grounds. ↩
There are major differences between state policies, but for a more comprehensive view of state policies, go to FAMM’s detailed breakdown on state practices in their 2018 report. ↩
In a uniquely positive development, new guidelines for federal prisons issued by the U.S. Sentencing Commission do not require a short-term “terminal” prognosis, as an excellent article in Health Affairs points out. ↩
The “ultimate decision-makers” vary greatly by jurisdiction. For example, in the federal system, the prison warden makes a recommendation, but the final word on compassionate release comes from the Central Office of the Bureau of Prisons. In other jurisdictions, courts have the final say on compassionate release: in D.C., decisions are made in the superior court, and in Ohio the sentencing court rules on compassionate release. The Department of Corrections’ commissioner makes the decision in Massachusetts, Minnesota, and Mississippi (in Mississippi, the decision is made jointly with the Chief Medical Officer). In Arizona, Virginia, and West Virginia, the governor decides who is granted compassionate release after hearing a recommendation from the parole board. Many states rely on the parole board to make compassionate release decisions, including Alabama, California, and North Carolina. For the decision makers in every state, see FAMM’s state-specific memos. ↩
Parole boards are granting parole contingent on participation in programs that are often not readily available for people behind bars, especially during the pandemic.
With public health officials and criminal justice reform advocates urging prisons to reduce their populations, people who have already been approved for release should be the first to return to their communities and families. Instead, thousands of them are waiting behind bars — where social distancing is impossible — as prisons across the country become the epicenters of the COVID-19 pandemic.
These are the people who have already been granted parole by the state parole boards, but have not yet taken a class or program that the parole board requires them to complete before they can go home. They are near enough to the end of their sentences to be parole-eligible, and the parole board has determined that they are “safe” to return to the community, but they cannot be released until they complete a program, often a drug and alcohol treatment program.
Parole boards are granting parole contingent on participation in programs that are often not readily available for people behind bars. If states changed their policies to allow for these programs to occur in the community upon re-entry, they would see the prison population drop without making any other significant release policy changes. Studies show that, at least for the therapeutic community model used in many prison systems, there is nothing unique to the prison context that makes these programs more effective than when they are done in the community.
Tennessee offers a striking example of this potentially devastating policy failure. Over 1,300 COVID-19 cases in Tennessee are connected to a single state prison — Trousdale Turner Correctional Center — making it the third largest source of COVID-19 cases in the country. As Nashville defense attorney David Raybin explained to NewsChannel5, over 1,000 people in Tennessee prisons have been approved for parole but are waiting to participate in the mandated programming, most often the Department of Correction’s therapeutic community program, which lasts 9-12 months. That means Tennessee could reduce its prison population by almost 4% by releasing just those who have already been approved for parole.1
Evidence shows that these programs are effective whether offered before or after release, but states have been reluctant to offer these programs in communities instead of in prisons. But of course, education and treatment programming across the nation’s prison systems have been interrupted by the virus, as volunteers and educators are no longer entering the prison system on a regular basis; in Tennessee, the Department of Correction released a statement that the virus is causing “some disruption in programming.” Even in the best of times, participation in these programs is limited and people wait behind bars for a space in the program before they can be released.
This is not a new problem for Tennessee. Before the pandemic, a taskforce commissioned by the governor found that 40% of people granted parole from 2015-2019 had not actually been released because they were still waiting to participate in pre-release programs mandated by the parole board. That means that over those four years, more than 6,000 people were parole-eligible, reviewed and approved for release by the parole board, and then remained in prison simply because the mandated program was not offered at their facility or the maximum number of participants had already been reached.
Where did this problem come from?
Every state is different, but in Tennessee and some other states, the parole board appears to decide the criteria for someone’s release, while the prison system runs the classes and decides who is eligible to take them. Governors and state legislators need to be aware that these two parts of the criminal justice system are working against each other and against public health.
Nor is this problem unique to Tennessee. A 2015 survey by the Robina Institute revealed that at least 40 states use “institutional program participation” as a factor in release decision-making for parole. In Texas, families have voiced their concern about loved ones who have been granted parole, but are still waiting to complete a pre-release program. Officials report that people often wait for months after being granted parole to begin these programs that provide education, life skills and employment training, substance abuse treatment, and other important re-entry supports. But waiting for programming that is on-hold or indefinitely postponed is no reason for people to remain in prison, especially when incarceration puts them at a heightened risk for contracting the virus.
If parole boards do not change this practice, for as long as the virus causes a “disruption in programming,” the number of people approved for parole but still in prison will continue to grow. The solution is obvious: Parole boards can waive the requirement or offer the therapeutic community programming after release. Especially given the current public health crisis, it makes sense for these programs — which, again, have been shown to be effective when offered after release — to be moved to the community setting when it is safe to do so. And in the meantime, people who have been approved for parole should be released as quickly as possible as part of the state’s efforts to protect incarcerated people and the larger community.
The Prison Policy Initiative is exploring doing a larger project evaluating prison programming, particularly the programming used to make parole decisions. If you happen to have copies of the curricula for any programs run in your state, please send a copy to virusresponse@prisonpolicy.org.
Footnotes
Tennessee’s total prison population on March 31st, 2020 was 26,124, according to the Vera Institute of Justice’s recent report, People in Prison 2019, so releasing 1,000 people would be a 4% reduction. ↩
Some correctional authorities - responding to bad guidance from the IRS - are intercepting and returning stimulus checks for incarcerated people. We explain why people in prison and jail are eligible for, and should be receiving, emergency aid.
September 24, 2020: A judge in California issued a ruling requiring the IRS to process stimulus payments for incarcerated people. This isn’t quite the end of the story, though — the judge’s ruling could be stayed or reversed on appeal, or Congress could amend the law to prohibit payments to incarcerated people. Read more.
June 30, 2020: Since this article came out, other commentators have also raised questions about IRS’s lack of justification for withholding stimulus payments from incarcerated people who otherwise meet the statutory criteria. Some have even pointed out that the last time Congress enacted a program of individual stimulus payments (in 2009), some incarcerated people were excluded from eligibility. This illustrates that Congress knows how to exclude incarcerated people when it wants to, but it took no such action in the CARES Act.
As far as the prevalence of the issue, the Associated Press reports that “hundreds of thousands of dollars” in stimulus payments were sent to incarcerated recipients. The same article states that prison systems in Kansas, Idaho, Montana, Vermont, Mississippi, Pennsylvania, Arizona, California, and Oregon have all intercepted and returned payments that were mailed to people in state prisons. The General Accounting Office’s report on pandemic programs states that the IRS “worked with federal and state prison officials to assist in the return of payments made to incarcerated individuals.” This admission from IRS is particularly puzzling given that the agency is currently warning hospitals and nursing homes not to intercept stimulus payments sent to patients because the payments belong to the individual recipient, not the facility. The IRS has not given any explanation of why prisons are different from hospitals in this regard.
On March 27, Congress passed the Coronavirus Aid, Relief, and Economic Security Act, more commonly known as the “CARES Act.” One of the better-known aspects of the 883-page bill is the Treasury’s disbursement of one-time economic stimulus payments, which were designed with broad eligibility requirements to get financial relief into people’s pockets as quickly as possible.
Now, the IRS is claiming that incarcerated people do not “qualify” for stimulus payments and the agency is attempting to “claw back” badly needed funds from vulnerable people who may need it most. But this policy is contradicted by the unambiguous language of the CARES Act itself.
Does incarceration make people ineligible for stimulus payments?
In short: According to the CARES Act, no. The provision regarding the stimulus payments is fairly straightforward: the government is directed to distribute $1,200 to every “eligible individual.”1 An eligible individual is defined as “any individual” other than a nonresident immigrant, someone who is claimed as a dependent on another person’s tax return, a probate estate, or a trust.2 Other parts of the law reduce the size of payments to high-earning taxpayers3 and require eligible individuals to have tax ID numbers.4 These basic eligibility requirements appear in the law itself, and are repeated on the IRS’s webpage regarding stimulus payments. There is no language in the statute that directly or indirectly suggests that incarceration status affects eligibility.
Why have I heard that payments to incarcerated people should be returned?
On May 6, 2020, the IRS updated the frequently asked questions (“FAQs”) on its webpage to say that incarcerated people do not qualify for stimulus payments and should return any payments that they receive. The IRS cites no authority for this, and the only law mentioned in the FAQ is the statute that prohibits incarcerated people from receiving Social Security payments. But this is irrelevant since the stimulus payments are refundable tax credits5 having nothing to do with Social Security. Despite the fact that this new advice comes from an IRS FAQ page, and not from the CARES Act itself, it has been cited widely in publications like Forbes, leading to a lot of confusion.
How is it possible that the IRS website would give advice that’s not consistent with the law?
There is a well-defined process for the IRS to issue rules and regulations that supplement tax laws passed by Congress. The purported ban on stimulus payments to incarcerated people was not a result of this rulemaking process. Instead, it appears that IRS made up this “rule” out of whole cloth and announced it by posting it on a webpage.
It’s impossible to say why the IRS took this unusual approach, but here’s one theory: someone in the Treasury Department may have decided that giving money to incarcerated people is bad policy. Of course, the IRS is severely under-resourced, as a result of decades of attacks by grandstanding members of Congress, so the agency doesn’t have the time or staff to go after individual incarcerated people to claw back stimulus payments. And the IRS would likely lose in court if such an action were challenged in litigation. But, by placing an FAQ on the agency’s website saying that incarcerated people cannot receive the payments, some prison systems will probably do the IRS’s dirty work by using the FAQ as a justification to intercept payments or bring disciplinary action against people who take the steps to claim the money to which they are legally entitled. In fact, we’ve heard that at least one state prison system is already doing this.
It is entirely reasonable to give emergency financial aid to incarcerated people
Even though this issue is fundamentally about the rule of law (more about that in a minute), as a practical matter some people can’t fathom giving money to incarcerated people or others who are “dependent” on the government. But there are good reasons why people in jail or prison need emergency aid in these unprecedented times. First, many incarcerated people will be released soon (especially people in jail, where stays tend to be for short periods of time). Navigating the financial hurdles of post-incarceration life is difficult even in normal times. But to state the obvious, we are not in normal times: given the record-high unemployment rates, the well-documented challenges of finding work as a formerly incarcerated person are only going to get more formidable. It makes perfect sense for the government to provide monetary aid so that recently released people can obtain housing, clothing, and food. The CARES Act stimulus payments, while modest, can provide literally lifesaving assistance for people being released from incarceration.
It also makes sense to give money to people who won’t necessarily be released from custody soon. Prisons and jails have shifted more and more costs onto incarcerated people — costs for things like hygiene supplies, medical copayments, and communication with loved ones. Since incarcerated people have little ability to earn money, they tend to rely on money transfers from friends and family to pay for basic necessities. But as family members on the outside (who are often low-income to begin with) lose their jobs in the pandemic-induced economic collapse, families will be increasingly less able to send money to loved ones inside. Providing stimulus funds to incarcerated people helps protect the health and well-being of those behind bars and provides relief to their loved ones at home.
The implications of the IRS’s policy for our government and the rule of law
Beyond the immediate implications for incarcerated people and their families, the IRS’s errant attempt to prevent incarcerated people from receiving stimulus payments is troublesome because it upends our system of government, specifically the separation of powers. Executive-branch agencies (like the IRS) are charged with implementing the laws passed by Congress, not changing the law. But that seems to be exactly what’s happening here: Congress said to give everyone money, but then the Treasury Department thought that incarcerated people should have been excluded. As every first-year law student learns, it is settled law that unambiguous statutes are to be applied as written, even if that could lead to arguably unintended consequences.6
Furthermore, interfering with the administration of the federal tax system (which would presumably include interfering with someone’s ability to claim a valid tax refund) is a federal crime.7 But we live in a time when the national government operates under a philosophy that only some people (namely, people without the right connections) are obliged to obey the law. The IRS’s sudden about-face on stimulus payments provides a troubling illustration of this mindset: a government agency has ignored the clear-cut language of the governing law in an effort to impose additional punishment on people who are serving time for violating other laws.
Even though the stimulus payments are tax credits, the CARES Act is very clear that people may claim the payments even if they have no taxable income. SeeRevenue Procedure 2020-28. ↩
See Magwood v. Patterson, 561 U.S. 320, 334 (2010) (“[Courts] cannot replace the actual text [of a statute] with speculation as to Congress’ intent.”); Henson v. Santander Consumer USA, 137 S.Ct. 1718, 1725 (2017) (“[I]t is never our job to rewrite a constitutionally valid statutory text under the banner of speculation about what Congress might have done had it faced a question that, on everyone’s account, it never faced.”). ↩
Our updated analysis finds that jails are responding to the unprecedented public health crisis by rapidly dropping their populations. In contrast, state prisons have barely budged.
This article was updated on October 21st, 2021 with more recent jail and prison population data. That version should be used instead of this one.
In the last two months, local governments across the U.S. have drastically reduced their jail populations to slow the spread of the coronavirus. The typical jail has reduced its population by more than 30%. But state prisons — where social distancing is just as impossible as in jails, and correctional staff still move in and out every day — have been much slower to release incarcerated people: The typical prison system has reduced its population by only 5%. Below, we compare the population cuts in local jails to those in state prisons, discussing just how little states are doing to keep their residents (and the general public) safe. (And note, our use of the term “reduction” is a purposeful distinction from “release,” as we have found that there are multiple mechanisms impacting populations, of which releases are but one part.)
While jails continue to make quick changes in the face of the pandemic, they house only 1/3rd of the incarcerated population, while the other two-thirds are held by state and federal authorities, who are moving far too slowly. After North Dakota, the six states with the largest reductions share an important quirk: they are all small state prison systems that serve as both prisons and jails. For that reason, much of their reduction could be the result of drops in the jail portion of their populations and it is possible that the reduction of their sentenced prison population may be much smaller. The one exception is Connecticut, which after the previous version of this report sent us data showing that their pretrial population decreased 10% and their sentenced population decreased by 11% from March 1st to April 29. (For detailed data on 131 large jails, see Table 1 below and for the data on more than 600 jails see our appendix, and for the smaller changes in 41 state prison systems and the federal Bureau of Prisons, see Table 2 below.)
The strategies jails are using to reduce their populations vary by location, but they add up to big changes. In some counties, police are issuing citations in lieu of arrests, prosecutors are declining to charge people for “low-level offenses,” courts are reducing the amounts of cash bail, and jail administrators are releasing people detained pretrial or those serving short sentences for “nonviolent offenses.” (We’re tracking news stories and official announcements of the most important changes in the country on our virus response page.)
Table 1: Largest known population reductions in large local jails
Table 1. Most large jails have reduced their detained population by at least 25% in response to the pandemic, and many jails have gone much further. (And for jails of all sizes with available data, the median population reduction is 32%.) (This table is based on the daily populations of 607 jails collected by the NYU Public Safety Lab, and then filtered to show only 131 large jails — with a pre-pandemic population of at least 350 people — and those that had available population counts that pre-date the start of the pandemic. Our analysis excludes jails whose population counts were not collected prior to the pandemic because we did not want to under-report the scale of the population reductions in jails that took early decisive action. We excluded smaller jails from this table because small population variations in smaller jails can look more significant than they are. However, in the aggregate, smaller jails appear to be reducing their populations even more than larger jails because the median jail reduction for jails of all sizes is 32%. Subsequent versions of this briefing will experiment with calculating jail population reductions using a rolling 7-day average as a way to minimize the need to discuss large and small jails separately. For the data on all 607 jails with available data, see the appendix.
County jail
State
Percentage reduction
Pre-COVID-19 jail population (large jails 350 or more people)
Most recent jail population
Pre-COVID date
Most recent date
Clackamas
OR
63%
403
148
1/27/20
5/12/20
Faulkner
AR
58%
433
180
1/1/20
5/12/20
Bergen
NJ
57%
573
248
1/31/20
5/12/20
Snohomish
WA
55%
786
350
1/1/20
5/12/20
Scott
IA
52%
464
224
2/11/20
5/11/20
Kenton
KY
52%
722
350
1/29/20
5/11/20
Washington
AR
49%
714
362
1/1/20
5/12/20
Pulaski
KY
48%
371
192
1/29/20
4/30/20
Washington
OR
48%
881
461
2/28/20
5/12/20
Jefferson
CO
46%
1243
673
1/28/20
5/12/20
Rowan
NC
46%
373
203
2/26/20
5/12/20
Yakima
WA
46%
843
459
2/27/20
5/12/20
Cabarrus
NC
45%
360
197
2/11/20
5/12/20
Yuba
CA
43%
394
224
2/3/20
5/12/20
Polk
IA
43%
876
503
1/1/20
5/12/20
Spalding
GA
42%
409
236
2/26/20
4/29/20
Davidson
NC
42%
368
215
1/7/20
5/12/20
Arapahoe
CO
41%
1183
696
1/1/20
5/12/20
York
SC
41%
421
250
2/18/20
5/12/20
San Juan
NM
39%
458
278
1/1/20
5/12/20
Salt Lake
UT
39%
2089
1268
1/31/20
5/12/20
Henderson
KY
39%
439
268
2/11/20
5/12/20
Floyd
GA
38%
678
418
1/29/20
4/14/20
McCracken
KY
38%
567
350
2/11/20
5/11/20
Boulder
CO
38%
602
372
1/1/20
5/12/20
Carroll
GA
38%
464
287
2/6/20
4/20/20
Benton
AR
38%
710
441
2/11/20
5/12/20
Clermont
OH
37%
392
248
1/1/20
5/12/20
Lexington
SC
37%
499
316
2/11/20
5/12/20
Putnam
TN
37%
366
232
2/3/20
5/12/20
Bulloch
GA
36%
376
240
2/21/20
5/8/20
Gaston
NC
35%
631
407
1/30/20
5/12/20
Anderson
SC
35%
410
265
2/27/20
5/11/20
Lafayette
LA
35%
936
605
1/1/20
5/12/20
Hamilton
OH
35%
1532
991
1/30/20
5/12/20
Berkeley
SC
35%
511
332
1/1/20
5/12/20
Knox
TN
35%
1415
920
1/28/20
5/12/20
Minnehaha
SD
34%
504
332
1/1/20
5/12/20
Lafourche
LA
33%
458
309
1/1/20
5/12/20
Daviess
KY
32%
704
476
1/29/20
5/8/20
Shawnee
KS
32%
530
360
1/28/20
5/12/20
Blount
TN
32%
537
365
2/26/20
5/12/20
Baldwin
AL
32%
559
380
2/28/20
5/12/20
Buncombe
NC
32%
525
358
1/28/20
5/4/20
Kane
IL
32%
489
334
1/21/20
5/12/20
St Joseph
IN
32%
613
419
1/29/20
5/5/20
Racine
WI
31%
753
517
2/28/20
5/12/20
Ellis
TX
31%
410
282
1/25/20
5/12/20
Chatham
NC
30%
1743
1213
2/2/20
5/6/20
Worcester
MA
30%
753
529
2/11/20
4/28/20
Marion
OR
29%
414
292
1/9/20
5/12/20
Galveston
TX
29%
1002
707
1/28/20
5/12/20
Christian
KY
29%
759
536
1/30/20
5/12/20
Houston
AL
29%
361
257
1/23/20
5/12/20
Campbell
KY
29%
604
430
2/11/20
5/11/20
Lancaster
NE
27%
606
440
2/11/20
5/11/20
Tulare
CA
27%
1548
1125
2/11/20
5/12/20
Cumberland
ME
27%
354
258
1/1/20
5/12/20
Tippecanoe
IN
27%
490
359
2/28/20
5/12/20
Franklin
OH
26%
1923
1420
1/1/20
5/12/20
Monroe
FL
26%
507
375
1/7/20
5/12/20
Spartanburg
SC
26%
742
549
2/11/20
5/12/20
Bell
TX
25%
857
639
1/1/20
5/12/20
Norfolk
VA
25%
961
720
1/31/20
5/12/20
Bonneville
ID
25%
376
282
1/1/20
5/12/20
Pamunkey
VA
25%
361
271
2/11/20
5/12/20
New Hanover
NC
24%
454
343
1/28/20
5/12/20
Terrebonne
LA
24%
647
491
1/28/20
5/12/20
Milwaukee
WI
24%
1890
1441
1/1/20
5/12/20
Guilford
NC
24%
1060
809
2/11/20
4/29/20
Tangipahoa
LA
23%
587
452
2/19/20
5/12/20
Boone
KY
22%
427
331
1/1/20
5/12/20
Will
IL
22%
739
573
1/27/20
5/12/20
Blue Ridge Lynchburg
VA
22%
492
382
2/11/20
5/11/20
Warren
KY
22%
684
532
2/29/20
5/12/20
Fulton
KY
22%
497
387
1/29/20
5/11/20
Bernalillo
NM
22%
1573
1227
1/1/20
5/12/20
Hopkins
KY
22%
397
310
1/29/20
5/11/20
Tom Green
TX
21%
438
344
1/1/20
5/12/20
Kenosha
WI
21%
533
419
2/16/20
5/12/20
El Dorado
CA
21%
389
306
1/21/20
5/12/20
Dauphin
PA
21%
1121
882
1/1/20
5/12/20
Virginia Beach
VA
20%
1486
1188
1/31/20
5/12/20
Ouachita
LA
20%
1173
940
2/15/20
5/12/20
Walton
FL
18%
471
385
1/1/20
5/12/20
Canyon
ID
18%
420
345
1/1/20
5/6/20
Iberia
LA
17%
409
338
1/28/20
5/12/20
Yavapai
AZ
17%
473
391
1/1/20
5/12/20
Santa Rosa
FL
17%
681
563
2/4/20
4/2/20
Avoyelles
LA
17%
424
351
2/11/20
5/12/20
Sumter
FL
17%
442
366
1/28/20
5/7/20
Franklin
LA
17%
833
690
1/1/20
5/12/20
Richland
LA
17%
755
626
1/29/20
5/12/20
Lancaster
PA
17%
781
650
2/11/20
5/12/20
Monroe
NY
17%
758
631
2/28/20
5/12/20
Shasta
CA
17%
466
388
2/11/20
5/12/20
Stanislaus
CA
17%
1305
1088
2/5/20
5/12/20
Riverside
VA
17%
1368
1141
1/25/20
5/12/20
Middle River
VA
17%
884
738
1/31/20
5/12/20
Prince Georges
MD
16%
848
709
1/1/20
5/12/20
Aiken
SC
16%
631
529
2/26/20
5/12/20
Shelby
TN
16%
1819
1527
1/1/20
5/12/20
Wake
NC
16%
1288
1082
2/11/20
5/12/20
Webster
LA
16%
668
562
2/19/20
5/11/20
Claiborne
LA
16%
581
489
1/1/20
5/12/20
Rapides
LA
16%
875
737
1/31/20
5/12/20
Pike
KY
16%
400
337
1/29/20
5/12/20
Escambia
FL
14%
1450
1241
2/28/20
5/12/20
Kemper
MS
14%
381
327
1/1/20
5/12/20
Brown
WI
14%
721
619
1/31/20
5/11/20
St Charles
LA
14%
469
403
1/28/20
5/12/20
Western Virginia
VA
14%
880
757
1/25/20
5/12/20
Wayne
MI
13%
2069
1800
1/1/20
5/12/20
Sarasota
FL
13%
883
772
1/30/20
5/12/20
Alachua
FL
12%
690
607
1/1/20
5/12/20
Jackson
MO
12%
737
649
1/1/20
5/12/20
Morehouse
LA
12%
484
427
1/29/20
5/12/20
Caldwell
LA
11%
612
543
2/19/20
5/12/20
Randall
TX
11%
389
347
2/22/20
5/12/20
Morgan
AL
9%
600
547
2/26/20
5/12/20
Morgan
TN
9%
600
547
2/26/20
5/12/20
Broward
FL
8%
1685
1542
1/1/20
5/12/20
St Lucie
FL
7%
1291
1196
1/30/20
5/12/20
Lubbock
TX
7%
1243
1155
1/28/20
5/6/20
Meherrin River
VA
7%
421
392
2/11/20
5/12/20
Comanche
OK
4%
358
343
2/11/20
5/12/20
Clay
FL
4%
397
381
1/30/20
5/12/20
Yazoo
MS
3%
553
538
1/29/20
4/24/20
St Johns
FL
1%
412
406
1/28/20
5/12/20
Ector
TX
0%
592
592
2/21/20
5/12/20
Yuma
AZ
increased by 7%
356
381
1/1/20
5/12/20
Meanwhile, state Departments of Correction have been announcing plans to reduce their prison populations — by halting new admissions from county jails, increasing commutations, and releasing people who are medically fragile, elderly, or nearing the end of their sentences — but our analysis finds that the resulting population changes have been small.
Table 2: Most state prison systems show only very modest population reductions (showing 41 states — and the Federal Bureau of Prisons — where the data was readily available)
Table 2. The Vera Institute of Justice has collected and made available for this report the pre-pandemic population counts (as of December 31st, 2019) and current (as of late April/early May) counts for 41 state prison systems and the federal Bureau of Prisons. For information about the most important policy changes announced in the states that made these small reductions possible, see our COVID-19 response tracker. *Importantly, there are six states with small state prison systems that serve as both prisons and jails.
State
Percentage reduction
Pre-COVID-19 prison population
Most recent prison population
North Dakota
19%
1,794
1,461
Hawaii*
18%
5,179
4,260
Vermont*
15%
1,608
1,369
Rhode Island*
13%
2,740
2,395
Alaska*
11%
4,475
3,985
Connecticut*
11%
12,293
10,973
Delaware*
11%
5,692
5,081
Utah
10%
6,731
6,064
Oregon
9%
15,755
14,355
Kentucky
9%
23,436
21,397
New York
8%
44,284
40,956
Colorado
7%
19,714
18,419
Nevada
6%
12,942
12,127
Louisiana
6%
31,609
29,682
New Jersey
6%
18,613
17,519
Wisconsin
5%
23,956
22,681
Massachusetts
5%
8,205
7,778
North Carolina
5%
34,510
32,795
California
5%
125,507
119,327
Texas
5%
158,820
151,126
Mississippi
5%
19,469
18,553
Pennsylvania
4%
45,875
43,852
Idaho
4%
9,437
9,028
Kansas
4%
10,177
9,740
New Hampshire
4%
2,622
2,513
Iowa
4%
9,282
8,899
Alabama
4%
28,266
27,164
Maine
4%
2,205
2,123
West Virginia
4%
6,800
6,550
Florida
4%
96,009
92,574
Missouri
3%
26,044
25,133
Georgia
3%
55,556
53,648
BOP
3%
175,116
169,426
Oklahoma
3%
25,712
24,947
Michigan
3%
38,053
36,980
Ohio
3%
49,762
48,453
Arizona
2%
42,441
41,386
Arkansas
2%
17,759
17,331
South Carolina
2%
18,608
18,160
Indiana
2%
27,268
26,707
Nebraska
2%
5,651
5,537
Wyoming
1%
2,479
2,465
Some states’ prison population cuts are even less significant than they initially appear, because the states achieved those cuts partially by refusing to admit people from county jails. (At least Colorado, Illinois, California, and Oklahoma are doing this.) While refusing to admit people from jails does reduce prison density, it means that the people who would normally be admitted are still being held in different correctional facilities.
Other states are indeed transferring people in prison to outside the system, either to parole or to home confinement, but these releases have not amounted to significant population reductions. For example, the Iowa Department of Corrections has released over 800 people nearing the end of their sentences since March 1st, but the overall net change in Iowa’s incarcerated population has only been about 4%. Kentucky Governor Andy Beshear commuted the sentences of almost 200 people convicted of felonies in early April, and the state also planned to release 743 people within 6 months of completing their sentences. Since December 2019, the Kentucky prison population has only decreased by a net 9%, while more than 85% of the jails we analyzed had dropped their populations by 10% or more.
Of the states we analyzed, those with smaller pre-pandemic prison populations appeared to have reduced their populations the most drastically. The prison population has dropped by 19% in North Dakota, the same state that we found to have the most comprehensive and realistic COVID-19 mitigation plan in our April 2020 survey. North Dakota has done more to reduce its state prison population than any other state, but even that state has done less than the typical jail in the country which has reduced its population by more than 30%.
States clearly need to do more to reduce the density of state prisons. For the most part, states are not even taking the simplest and least controversial steps, like refusing admissions for technical violations of probation and parole rules, and to release those that are already in confinement for those same technical violations. (In 2016, 60,000 people were returned to state prison for behaviors that, for someone not on probation or parole, would not be a crime.) Similarly, other obvious places to start are releasing people nearing the end of their sentence, those who are in minimum security facilities and on work-release, and those who are medically fragile or older.
If the leadership and success of local jails in reducing their populations isn’t enough of an example for state level officials, they may find some inspiration in the comparative success of other countries:
Table 3: Countries reducing their incarcerated populations in the face of the pandemic (showing 13 countries where current population data was readily available)
Table 3. The United States incarcerates more people than any other country, and all U.S. states incarcerate at higher rates than most countries. Countries around the world are recognizing that public safety includes protecting society from the unnecessary spread of COVID-19, and are reducing their prison populations in order to meet that goal. (Release counts collected by Prison Policy Initiative from news stories covering international prison and jail releases. Percentage of reductions calculated by the Prison Policy Initiative based on pre-pandemic populations — including pretrial and remand detainees — from the World Prison Brief.)
Country
Percentage reduction
Pre-COVID-19 prison population
Number released
Pre-COVID date
Date of releases
Afghanistan
33%
30,748
10,000
2018
3/26/20
Turkey
31%
286,000
90,000
2019
4/14/20
Iran
29%
240,000
70,000
2018
3/17/20
Myanmar
26%
92,000
24,000
2018
4/17/20
South Sudan
20%
7,000
1,400
2019
4/20/20
The Gambia
17%
691
115
2019
4/26/20
Indonesia
14%
270,387
38,000
3/31/20
4/20/20
France
14%
72,000
10,000
3/2020
4/15/20
Ireland
13%
3,893
503
2018
4/22/20
Italy
11%
61,230
6,500
2/29/20
4/26/20
Kenya
9%
51,130
4,500
2018
4/17/20
Colombia
8%
122,085
10,000
2/29/20
3/31/20
Britain
5%
83,189
4,000
3/27/20
4/4/20
Prisons and jails are notoriously dangerous places during a viral outbreak, and public health professionals, corrections officials, and criminal justice reform advocates agree that decarceration will help protect both incarcerated people and the larger communities in which they live. It’s past time for U.S. prison systems to meaningfully address the crisis at hand and reduce the number of people behind bars.
This article updates one published on May 1st with a larger dataset of state prison population reductions collected by the Vera Institute of Justice and released alongside their report Prisoners in 2019, and with updated jail reduction figures collected by the NYU Public Safety Lab.
Our table shows that more than 10% of people incarcerated in state prisons are 55 or older - and in some states, like Montana, the percentage is much higher.
Prisons and jails have become the epicenter of the COVID-19 pandemic, with seven of the ten largest hotspots identified as state prisons and local jails. With the CDC having warned that older adults are at heightened risk for severe complications and death from COVID-19, readers have asked us: Just how many people in state prisons are older adults? We’ve answered this question — state by state — in a handy table below.
To prepare our table, we drew on the most recent age data from the National Corrections Reporting Program, 1991-2015. Age data for state prisons is broken down into categories, and older adults fall into the category of “55 and older.” Although outside of correctional facilities, the term “older adults” often refers to people 65 and older, incarceration itself shortens life expectancy and hastens physiological aging. So for the purposes of addressing how vulnerable different groups are to the coronavirus, it makes sense to consider adults 55 and older behind bars as “older adults.”
We found that, on average, more than 10% of people in state prisons are over the age of 55. Some state prison systems have much higher percentages of older adults, like in Montana, where over 17% of the state prison population is 55 years or older.
Regardless of their preexisting health conditions, all older adults are at greater risk for complications from COVID-19. As this virus threatens to turn their prison sentences into death sentences, states should use all possible strategies to release them to the care of their families.
The percentage and count of state prison population that is 55 and older, as well as total prison population, by state for the most recent year possible. Compiled by Prison Policy Initiative from National Corrections Reporting Program, 1991-2015 using year-end populations. For the number and percent of state prison populations 55 and older over time (1999-2015), see our spreadsheet, Percent of prison populations 55 and older, by state, 2013-2015 [xlsx].
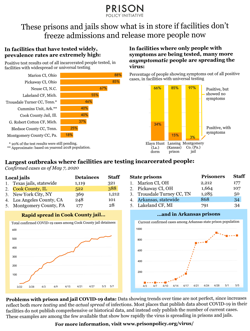
Our fact sheet for advocates shows how rapidly the coronavirus can spread through correctional facilities, and how high infection rates in prisons and jails already are.
To help advocates argue for more aggressive decarceration as COVID-19 spreads rapidly through the nation’s prisons and jails, we’ve created a one page PDF fact sheet.
The fact sheet includes new analysis of recent COVID-19 data, largely gathered by the UCLA School of Law COVID-19 Behind Bars Data Project, put into context using other government data sources. As a result, we were able to make a series of tables and charts to show:
Prevalence rates of the virus in facilities that have conducted widespread testing;
How many asymptomatic people test positive in facilities with universal testing — indicating that in places where only the few people with symptoms are being tested, many more untested people are spreading the virus;
The largest outbreaks in jails and prisons where facilities are testing incarcerated people; and
The rapid spread of the virus over time in the few places that publish historical data, such as the Cook County (Chicago) jail and Arkansas prison system.
We also discuss the problems with prison and jail COVID-19 data; namely, that the data we have only reflect test results, and most places still are not testing widely. What we’ve learned from the places testing everyone — not just people showing symptoms — is that the virus is rampant among incarcerated people and correctional staff, which means that some prisons and jails are acting as “spreaders” of the virus in local communities.
The rapid spread of the virus among incarcerated people is unsurprising, since social distancing is impossible in the close quarters of prisons and jails. And incarcerated people, who disproportionately suffer from chronic illnesses that make them more vulnerable to the virus, are at incredible risk. As our new fact sheet shows, federal, state, and local authorities must freeze admissions and release more people now to prevent further spread of the virus through incarceration.
As we have argued recently, in order to prevent more unnecessary COVID-19 related deaths among incarcerated people, authorities must minimize the use of pretrial incarceration. In the case of local jails, “authorities” means a complex web of jurisdictions and officials who have the authority to release people from jail. The federal system is a different story. Unlike local jails, federal pretrial detention is governed by a single set of laws, but that doesn’t simplify matters much when the actual decision-makers are spread out among 94 judicial districts.
So what are federal courts doing to reduce pretrial incarceration? We looked at some of the orders that federal courts have issued to deal with pretrial populations during the COVID-19 pandemic, and identified some important issues, promising approaches, and places where more dramatic action is needed.
Judges are traditionally hesitant to involve themselves with carceral operations, given the central role of separation-of-powers in American governance. But pretrial detention is a special situation, since people who are not convicted are in the custody of the court, and judges must decide whether or not defendants should be incarcerated pending trial.
Every federal court in the country has issued general orders modifying their operations during the current pandemic. Dozens of these orders address the treatment of pretrial detainees, but most of these provisions are disappointing in their narrow scope: Many orders simply require screening of symptoms, or encourage the use of video appearances, but do nothing to actually address the public health crisis posed by incarceration during a viral pandemic. Most notably, many orders instruct the US Marshals Service (which operates federal pretrial detention) to develop procedures for monitoring the health of incarcerated people, despite the Marshals’ well-documented indifference to the health of the people in its custody.
However, a handful of court orders — ranging from generalized statements of goals to specific policy changes — stand out as actually addressing the problem, and are worthy of discussion:1
Statements of policy. On the more generalized end of the spectrum, Minnesota’s district court has entered an order directing its office of pretrial services to “reassess whether alternatives to detention exist that in its judgment will reasonably assure the appearance of the defendant and the safety of the community.” This approach is commendable, but without careful attention to the details, it runs the risk of widening the use of troublesome “alternatives” like electronic monitoring.
Protecting health one case at a time. In the middle of the spectrum of judicial responses are courts that have decided to make case-by-case decisions on pretrial detention, but have provided new procedures for speeding up the process. The federal court for Alaska has created an expedited procedure to rule on requests from people seeking release from custody prior to trial or sentencing, which includes a procedure for defendants to obtain their own medical records for use as evidence. The courts in Massachusetts and the Eastern District of Michigan have entered similar orders, with the Michigan court specifically noting the need to “reduc[e] population density in BOP and detention facilities.”
Anticipating how facilities may undermine justice. The federal court in Montana has recognized that social distancing measures will inevitably lead to more defendants being forced to communicate with their lawyers via phone or video. Accordingly, that court’s general order specifies that when that happens, “the attorney-client privilege…is not waived by the presence of third parties or the existence of monitoring.” Importantly, these protections apply whether or not facilities or phone companies advise callers that their communications are being monitored.
The court for the Eastern District of New York has taken the most comprehensive approach, by emphasizing the need for meaningful information on the conditions in facilities where people are held. The court has identified the four facilities that hold most pretrial defendants in the Eastern District, and has ordered the wardens of those facilities to provide twice-weekly reports on mitigation measures and test results. The court order goes on to direct that such reports be posted on the court’s public website.
As one can see from reading the reports submitted to the New York Court, they are sparse on details and use the bureaucratic jargon common among correctional administrators. Nonetheless, this reporting requirement is an important first step in combatting one of the pandemic’s most importantdriversoffear: the lack of information.
As a currently incarcerated author noted in an article published last week, “The only way to significantly reduce inevitable deaths from an outbreak inside is to reduce the number of people inside.” While none of the court orders discussed here directly release anyone from custody, they highlight some of the issues that we will have to address when pushing for large-scale reductions in incarceration: facilitating judicial decision-making about releases, preserving privacy in an age of digital communications, and prying factual information out of correctional bureaucracies that are generally hostile to transparency.
Footnotes
This is not to say that every court that hasn’t issued a general order on pretrial detention is failing to do something. Some courts may be addressing the issue informally, through robust case-by-case determinations, or through amendments to local rules. This briefing focuses on general orders because they are comparatively easy to locate. ↩
March 19, 2025: Join Prison Policy Initiative’s Advocacy Department at 1 PM EST on Wednesday, March 19, 2025, for a webinar about understanding recidivism. We will cover strategies from our recidivism toolkit, including an overview of recidivism statistics and what they really mean, how to combat the “Willie Horton” effect, and ways that advocates can transform the narrative around reentry to make it less focused on negative outcomes and more focused on the ways that returning citizens contribute to their communities.