March 19, 2025: Join Prison Policy Initiative’s Advocacy Department at 1 PM EST on Wednesday, March 19, 2025, for a webinar about understanding recidivism. We will cover strategies from our recidivism toolkit, including an overview of recidivism statistics and what they really mean, how to combat the “Willie Horton” effect, and ways that advocates can transform the narrative around reentry to make it less focused on negative outcomes and more focused on the ways that returning citizens contribute to their communities.
New BJS reports show that jail and prison populations remain stubbornly high despite decreasing crime rates, and point to the shifting demographics of correctional populations.
The COVID-19 crisis is illustrating yet another danger of our overreliance on incarceration, as jails and prisons are rapidly becoming coronavirus hotspots. As correctional facilities around the country grapple with the crisis, two new Bureau of Justice Statistics (BJS) reports, Jail Inmates in 2018 and Prisoners in 2018, provide crucial details about our nation’s correctional populations. The reports highlight the slow pace of decarceration over the past decade, the persistence of pretrial detention despite calls for reform, and the changing demographics of prisons and especially of jails.
Of course, because of COVID-19, jail incarceration in particular has changed dramatically in just a matter of weeks. It remains to be seen whether jail populations will bounce back up after the pandemic subsides, or whether decarceration will become the “new normal” – or at least a more politically acceptable strategy in places that have been reluctant to reduce jail populations. Either way, the pre-pandemic data in the BJS reports are helpful in understanding how we got to the point where so many people are needlessly jailed, and they reveal important demographic shifts in jail populations that merit further action.
Incarceration rates are dropping far too slowly, largely due to pretrial detention
Both of the new BJS reports boast of declining correctional populations, but a closer look at the data reveals the pace of decarceration is still far too slow. Prisoners in 2018 reports that prison populations decreased 9% between 2008 and 2018, meaning prison populations, on average, declined by less than 1% each year. As the nation with the highest incarceration rate in the world, such small declines represent a national failure.
The rate of decarceration in jails is similarly slow, and jail populations have even ticked up in recent years. Although Jail Inmates in 2018 and its press release boast that the “jail incarceration rate decreased 12% from 2008 to 2018,” most of that drop happened over five years ago; the jail population barely budged between 2015 and 2018. There were actually over 18,000 more people in jail on an average day in 2018 than in 2015 – despite the fact that the overall crime rate declined 11% over the same period.
Even worse, the growth of jail populations over those years can largely be attributed to an increase in the number of people held pretrial. The vast majority of people in jails have not been convicted and are simply stuck in jail waiting for their day in court, and their number has increased by 6% since 2015, while the number of people in jail who were convicted declinedby 9%. That means pretrial detention has continued to drive all of the net jail growth in recent years, despite the fact that counties around the country are reforming their bail systems to reduce pretrial incarceration. Clearly, these measures have not gone far enough.
Gender, race, and geographic shifts in prison and jail populations
Another key takeaway from the recent reports: There have been striking demographic shifts in jail populations and, to a lesser extent, in prison populations. The number of women incarcerated in jails has increased, and while the women’s prison population is slowly falling, the decarceration of men in prisons continues to outpace that of women. Racial disparities remain persistent, but have actually narrowed in both prisons and jails. Finally, we see that rural jails have grown while urban jail populations have taken more significant steps toward decarceration.
Decarceration efforts seem to impact men’s populations more than women’s
In the ten-year period from 2008 to 2018, the number of women in local jails grew by 15%, while the number of men in jails fell by 9%, mirroring trends seen in many state prison systems and in arrests over the last decade. Our 2018 report found that, since 2009, women’s populations have fared worse than men’s populations in 35 state prison systems. Prisoners in 2018 reveals that the rate of decarceration for men still far outpaces that for women: The male prison population declined 9.3% from 2008 to 2018, but the female population only declined by 3.3%.
While not discussed in these reports, arrest trends may provide some insight into why women’s correctional populations aren’t dropping the way men’s are. Between 2008 and 2018, total arrests declined by 26.5% for men but only declined 13.6% for women. Worse, over these years, which were marked by the opioid crisis, the number of women arrested for drug offenses increased by 34%, while men’s drug arrests fell by almost 8%.
As we explain in Women’s Mass Incarceration: The Whole Pie, it is important to focus on women in local jails, because jails hold almost half of incarcerated women, and they can be especially harmful for women, who suffer from health problems at greater rates than men and more often the caretakers of children. In this light, the growth of women’s jail incarceration is especially troubling.
Racial disparities narrow as jail trends diverge in urban and rural areas
The recent BJS report also reveals that while racial disparities in incarceration persist, they are slowly narrowing. To be clear, Black people are still incarcerated at over 3 times the rate of white people in jails, and more than 5 times the rate of white people in prisons. But the jail incarceration rate for Black Americans is falling while the rate for white Americans is increasing. From 2008 to 2018, the jail incarceration rate for white Americans rose by 12% to 187 per 100,000, the Black incarceration rate fell by 28% to 592 per 100,000, and the Hispanic incarceration rate fell by 34% to 182 per 100,000. Meanwhile, in prisons, the Black incarceration rate declined by 28.2% from 2008 to 2018, while the white incarceration rate declined by 12.8% over the same period.
The changing racial demographics of jails in particular can in part be attributed to the shifting geography of jail incarceration: Jail populations have been shrinking in urban areas, but growing in rural areas, which are disproportionately white. Many urban areas have taken steps to cut their jail populations by reducing pretrial detention, creating alternatives to incarceration, and no longer prosecuting minor drug offenses. Meanwhile, in rural counties, pretrial detention continues to grow, local authorities are increasingly leasing out jail beds to state and federal governments, and there are fewer resources to develop alternatives to incarceration. And of course, rural areas have been devastated by the opioid crisis, and have tended to respond to the crisis with incarceration.
The COVID-19 crisis has drawn unprecedented national attention to the dangers of incarceration. As jails around the country take steps to reduce their jail population, sustained decarceration seems much more possible. As we move forward, these BJS reports show us the work ahead: We must dramatically increase the pace of decarceration, minimize pretrial detention, pay special attention to women’s incarceration and rural jails, and continue to reduce racial disparities.
Our analysis finds that jails are responding to the unprecedented public health crisis by rapidly dropping their populations. In contrast, state prisons have barely budged.
This article was updated on May 14th to use a new, larger, dataset produced by the Vera Institute of Justice that contains the population reductions of 41 state prison systems and the Bureau of Prisons and also updated on August 5th with more recent jail and prison population data. The newest version should be used instead of this one.
In recent weeks, local governments across the U.S. have drastically reduced their jail populations to slow the spread of the coronavirus. Many have reduced the number of people in jail by 25% or more, recognizing that the constant churn of people and the impossibility of social distancing in jails make them inevitable hotbeds of viral transmission. But state prisons — where social distancing is just as impossible, and correctional staff still move in and out every day — have been much slower to release incarcerated people. We decided to directly compare the population cuts in local jails to those in state prisons, to highlight just how little states are doing to keep their residents (and the general public) safe:
While jails continue to make quick changes in the face of the pandemic, they house only 1/3rd of the incarcerated population, while the other two-thirds are held by state and federal authorities, who are moving far too slowly. (For detailed data on 190 jails, see Table 1 below, and for the smaller changes in 15 state prison systems and the federal Bureau of Prisons, see Table 2 below.)
The strategies jails are using to reduce their populations vary by location, but they add up to big changes. In some counties, police are issuing citations in lieu of arrests, prosecutors are declining to charge people for “low-level offenses,” courts are reducing the amounts of cash bail, and jail administrators are releasing people detained pretrial or those serving short sentences for “nonviolent offenses.” (We’re tracking news stories and official announcements of the most important changes in the country on our virus response page.)
Table 1: Largest known population reductions in local jails (and a few disturbing increases)
Most jails have reduced their detained population by over 15%, and over one-third of jails have reduced their population by 25%. However, a handful of jails in Texas, Georgia, Louisiana, and others have seen troubling population increases. (Our analysis is based on a sample of 208 jails whose data is collected by the NYU Public Safety Lab, and because small changes in small jails can look more dramatic than they are, we excluded from this table the 672 jails with pre-pandemic populations under 350 people. Had we included those jails, the results would have been slightly more dramatic. For the data on all 812 jails with available data, see the appendix.)
County jail
State
Percentage reduction
Pre-COVID-19 jail population
Most recent jail population
Dates data collected
Clackamas
OR
66%
403
138
1/27/20 & 4/27/20
Kitsap
WA
58%
401
168
3/4/20 & 4/27/20
Kenton
KY
52%
722
345
1/29/20 & 4/26/20
Snohomish
WA
51%
786
383
1/1/20 & 4/27/20
Scott
IA
50%
464
232
2/11/20 & 4/27/20
Faulkner
AR
50%
433
218
1/1/20 & 4/27/20
Washington
AR
48%
714
372
1/1/20 & 4/27/20
Polk
IA
47%
876
466
1/1/20 & 4/27/20
Pulaski
KY
45%
371
203
1/29/20 & 4/25/20
Clark
WA
45%
660
366
3/3/20 & 4/27/20
Washington
OR
44%
881
497
2/28/20 & 4/27/20
York
SC
43%
421
240
2/18/20 & 4/27/20
Jefferson
CO
43%
1,243
712
1/28/20 & 4/27/20
Davidson
NC
42%
368
213
1/7/20 & 4/27/20
Spalding
GA
41%
409
240
2/26/20 & 4/27/20
Cabarrus
NC
40%
360
215
2/11/20 & 4/27/20
Adams
CO
40%
926
555
3/15/20 & 4/27/20
Gaston
NC
40%
631
382
1/30/20 & 4/27/20
Rowan
NC
39%
373
229
2/26/20 & 4/27/20
Arapahoe
CO
38%
1,183
730
1/1/20 & 4/27/20
Hamilton
OH
38%
1,532
946
1/30/20 & 4/27/20
Yakima
WA
38%
843
524
2/27/20 & 4/27/20
Floyd
GA
36%
675
429
1/28/20 & 4/27/20
Coweta
GA
36%
390
249
2/26/20 & 4/27/20
Hamilton
TN
36%
507
325
3/15/20 & 4/27/20
Knox
TN
36%
1,415
908
1/28/20 & 4/27/20
Dougherty
GA
35%
579
375
2/26/20 & 4/27/20
Minnehaha
SD
35%
504
328
1/1/20 & 4/27/20
Anderson
SC
35%
410
267
2/27/20 & 4/26/20
Multnomah
OR
35%
1,145
747
3/9/20 & 4/27/20
San Juan
NM
35%
458
299
1/1/20 & 4/27/20
Clermont
OH
35%
392
256
1/1/20 & 4/27/20
Pueblo
CO
35%
627
410
3/5/20 & 4/27/20
Hennepin Corrections
MN
35%
486
318
4/2/20 & 4/27/20
McCracken
KY
34%
567
374
2/11/20 & 4/27/20
Berkeley
SC
34%
511
339
1/1/20 & 4/27/20
Salt Lake
UT
34%
2,089
1,387
1/31/20 & 4/27/20
Boulder
CO
34%
602
400
1/1/20 & 4/27/20
Lexington
SC
34%
499
332
2/11/20 & 4/27/20
Benton
AR
33%
710
473
2/11/20 & 4/27/20
Yuba
CA
33%
394
263
2/3/20 & 4/27/20
Putnam
TN
33%
366
245
2/3/20 & 4/27/20
Baldwin
AL
33%
559
377
2/28/20 & 4/27/20
Houston
AL
32%
361
245
1/23/20 & 4/27/20
Cumberland
PA
32%
409
278
3/9/20 & 4/27/20
Buncombe
NC
32%
525
357
1/28/20 & 4/27/20
Douglas
GA
32%
614
418
2/11/20 & 4/27/20
Henderson
KY
31%
439
301
2/11/20 & 4/25/20
Marion
OR
31%
414
284
1/9/20 & 4/27/20
Cumberland
ME
31%
354
245
1/1/20 & 4/27/20
Tippecanoe
IN
31%
490
340
2/28/20 & 4/27/20
Chatham
NC
30%
1,743
1,213
2/2/20 & 4/27/20
St Joseph
IN
30%
613
427
1/29/20 & 4/26/20
Carroll
GA
30%
442
308
1/24/20 & 4/27/20
Tulare
CA
30%
1,548
1,080
2/11/20 & 4/27/20
Shawnee
KS
30%
530
370
1/28/20 & 4/27/20
Lafayette
LA
30%
936
658
1/1/20 & 4/27/20
Bergen
NJ
30%
573
403
1/31/20 & 4/27/20
Racine
WI
30%
753
530
2/28/20 & 4/27/20
Worcester
MA
29%
753
533
2/11/20 & 4/27/20
Galveston
TX
29%
1,002
710
1/28/20 & 4/27/20
Knox
KY
29%
384
273
3/15/20 & 4/27/20
Blount
TN
29%
537
383
2/26/20 & 4/27/20
Whitfield
GA
28%
474
340
3/4/20 & 4/27/20
Daviess
KY
28%
704
505
1/29/20 & 4/25/20
Franklin
OH
28%
1,923
1,383
1/1/20 & 4/27/20
Lafourche
LA
28%
458
330
1/1/20 & 4/27/20
Bell
TX
27%
857
624
1/1/20 & 4/27/20
Washington
NC
27%
455
332
3/9/20 & 4/27/20
Ellis
TX
26%
410
302
1/25/20 & 4/27/20
Saginaw
MI
26%
368
272
3/17/20 & 4/27/20
Campbell
KY
26%
604
447
2/11/20 & 4/26/20
Midland
TX
25%
474
355
3/13/20 & 4/27/20
Lancaster
NE
25%
606
454
2/11/20 & 4/27/20
Bonneville
ID
25%
376
284
1/1/20 & 4/27/20
Weber
UT
24%
1,030
779
3/16/20 & 4/10/20
New Hanover
NC
24%
454
344
1/28/20 & 4/27/20
Tom Green
TX
24%
438
333
1/1/20 & 4/27/20
Will
IL
24%
739
562
1/27/20 & 4/27/20
Milwaukee
WI
24%
1,890
1,442
1/1/20 & 4/27/20
Christian
KY
24%
759
580
1/30/20 & 4/27/20
Norfolk
VA
23%
961
738
1/31/20 & 4/27/20
Ware
GA
23%
406
312
1/25/20 & 4/27/20
Houston
GA
23%
683
526
4/12/20 & 4/27/20
Pamunkey
VA
23%
361
279
2/11/20 & 4/25/20
Monroe
FL
23%
507
393
1/7/20 & 4/27/20
Spartanburg
SC
22%
742
576
2/11/20 & 4/27/20
El Dorado
CA
22%
389
302
1/21/20 & 4/27/20
Warren
KY
22%
684
532
2/29/20 & 4/26/20
Guilford
NC
22%
1,060
826
2/11/20 & 4/27/20
Las Vegas
NV
22%
371
290
3/30/20 & 4/27/20
Shasta
CA
22%
466
365
2/11/20 & 4/27/20
Tangipahoa
LA
22%
587
461
2/19/20 & 4/27/20
Walton
FL
21%
471
370
1/1/20 & 4/27/20
Yellowstone
MT
21%
454
358
3/18/20 & 4/27/20
Hopkins
KY
20%
397
316
1/29/20 & 4/27/20
Dauphin
PA
20%
1,121
899
1/1/20 & 4/27/20
Madera
CA
20%
631
507
3/4/20 & 4/26/20
Travis
TX
20%
2,119
1,704
3/18/20 & 4/27/20
Bernalillo
NM
19%
1,573
1,274
1/1/20 & 4/27/20
Ouachita
LA
19%
1,173
954
2/15/20 & 4/27/20
Kenosha
WI
19%
533
434
2/16/20 & 4/27/20
Virginia Beach
VA
18%
1,486
1,213
1/31/20 & 4/27/20
Terrebonne
LA
18%
647
531
1/28/20 & 4/27/20
Forsyth
GA
18%
394
324
2/26/20 & 4/27/20
Lancaster
PA
18%
781
644
2/11/20 & 4/27/20
Santa Rosa
FL
17%
681
563
2/4/20 & 4/2/20
Laurel
KY
17%
672
556
3/15/20 & 4/27/20
Canyon
ID
17%
420
348
1/1/20 & 4/27/20
Escambia
FL
17%
1,450
1,204
2/28/20 & 4/27/20
Blue Ridge Lynchburg
VA
17%
492
410
2/11/20 & 4/27/20
Boone
KY
17%
427
356
1/1/20 & 4/27/20
Wayne
MI
16%
2,069
1,733
1/1/20 & 4/27/20
Iberia
LA
16%
409
343
1/28/20 & 4/27/20
Prince Georges
MD
16%
848
713
1/1/20 & 4/27/20
Webster
LA
16%
668
563
2/19/20 & 4/27/20
Alachua
FL
16%
690
583
1/1/20 & 4/27/20
Rapides
LA
15%
875
740
1/31/20 & 4/26/20
Oakland
MI
15%
917
776
4/9/20 & 4/27/20
Avoyelles
LA
15%
424
359
2/11/20 & 4/27/20
Clark Henderson
NV
15%
394
334
3/15/20 & 4/5/20
Franklin
LA
15%
833
707
1/1/20 & 4/26/20
Aiken
SC
15%
631
536
2/26/20 & 4/27/20
Riverside
VA
15%
1,368
1,165
1/25/20 & 4/27/20
Stanislaus
CA
15%
1,305
1,112
2/5/20 & 4/27/20
Wake
NC
15%
1,288
1,099
2/11/20 & 4/27/20
Brown
WI
14%
721
617
1/31/20 & 4/27/20
Yavapai
AZ
14%
473
405
1/1/20 & 4/27/20
Fulton
KY
14%
497
426
1/29/20 & 4/26/20
Monroe
NY
14%
758
651
2/28/20 & 4/15/20
Middle River
VA
14%
884
761
1/31/20 & 4/27/20
Claiborne
LA
14%
581
502
1/1/20 & 4/27/20
Sarasota
FL
13%
883
769
1/30/20 & 4/27/20
Shelby
MO
13%
512
446
3/15/20 & 4/27/20
Shelby
TN
13%
1,819
1,588
1/1/20 & 4/27/20
Bartow
GA
12%
589
516
1/1/20 & 4/27/20
Jackson
MO
12%
737
646
1/1/20 & 4/27/20
Richmond
GA
12%
1,003
884
2/28/20 & 4/27/20
St Charles
LA
12%
469
414
1/28/20 & 4/27/20
Morgan
AL
12%
600
531
2/26/20 & 4/27/20
Morgan
TN
12%
600
531
2/26/20 & 4/27/20
Washington
UT
11%
371
329
4/7/20 & 4/27/20
Pike
KY
11%
400
355
1/29/20 & 4/26/20
Randall
TX
11%
389
347
2/22/20 & 4/27/20
Western Virginia
VA
10%
880
792
1/25/20 & 4/27/20
Mohave
AZ
10%
351
316
4/8/20 & 4/27/20
Kings
CA
10%
488
441
4/8/20 & 4/27/20
Kemper
MS
9%
381
345
1/1/20 & 4/27/20
Martin
FL
9%
429
389
4/8/20 & 4/27/20
Virginia Peninsula
VA
9%
378
344
3/4/20 & 4/26/20
Caldwell
LA
9%
612
559
2/19/20 & 4/27/20
Morehouse
LA
9%
484
443
1/29/20 & 4/27/20
Meherrin River
VA
8%
421
388
2/11/20 & 4/26/20
Broward
FL
8%
1,685
1,557
1/1/20 & 4/27/20
St Lucie
FL
7%
1,291
1,196
1/30/20 & 4/27/20
Hardin
KY
7%
644
597
4/10/20 & 4/24/20
Denver
CO
7%
1,216
1,130
4/10/20 & 4/26/20
Cascade
MT
7%
419
391
3/21/20 & 4/27/20
Comanche
OK
6%
358
336
2/11/20 & 4/27/20
Lubbock
TX
6%
1,243
1,170
1/28/20 & 4/27/20
Dane
WI
6%
580
546
4/2/20 & 4/27/20
Baltimore City
MD
5%
1,459
1,387
4/1/20 & 4/27/20
St Johns
FL
5%
412
393
1/28/20 & 4/27/20
Northwest
OH
4%
526
504
4/17/20 & 4/27/20
Pierce
WA
4%
686
662
4/12/20 & 4/27/20
Summit
OH
3%
401
388
4/20/20 & 4/27/20
Henrico
VA
3%
1,133
1,098
4/12/20 & 4/27/20
Roanoke City
VA
3%
374
363
4/9/20 & 4/20/20
Yazoo
MS
3%
553
538
1/29/20 & 4/24/20
Clay
FL
3%
397
387
1/30/20 & 4/27/20
Orleans
LA
2%
817
797
4/8/20 & 4/26/20
Osceola
FL
2%
690
675
4/16/20 & 4/27/20
Bibb
GA
2%
795
779
4/26/20 & 4/27/20
Collin
TX
2%
942
925
4/9/20 & 4/27/20
Western Tidewater
VA
2%
736
724
4/15/20 & 4/26/20
Fort Bend
TX
1%
722
718
4/9/20 & 4/27/20
Mobile
AL
1%
1,086
1,080
4/17/20 & 4/27/20
Tarrant
TX
0%
3,484
3,474
4/6/20 & 4/27/20
Westchester
NY
0%
364
363
4/17/20 & 4/27/20
Newberry
SC
0%
514
513
4/8/20 & 4/27/20
Kern
CA
0%
733
732
4/20/20 & 4/27/20
Ector
TX
0%
592
592
2/21/20 & 4/27/20
Kaufman
TX
increased by 1%
380
382
4/20/20 & 4/27/20
Mecklenburg
NC
increased by 1%
1,397
1,409
4/8/20 & 4/27/20
Highlands
FL
increased by 1%
368
372
4/20/20 & 4/27/20
Walton
GA
increased by 1%
367
371
4/9/20 & 4/27/20
Pennington
SD
increased by 5%
445
469
4/9/20 & 4/27/20
Montgomery
TX
increased by 5%
584
616
4/8/20 & 4/27/20
Yuma
AZ
increased by 7%
356
382
1/1/20 & 4/27/20
Hennepin Jail
MN
increased by 10%
451
494
4/3/20 & 4/27/20
Meanwhile, state Departments of Correction have been announcing plans to reduce their prison populations — by halting new admissions from county jails, increasing commutations, and releasing people who are medically fragile, elderly, or nearing the end of their sentences — but our analysis finds that the resulting population changes have been small.
Table 2: Most state prison systems show only very modest population reductions (showing 15 states — and the Federal Bureau of Prisons — where the data was readily available)
Table 2. Data collected and analyzed by the Prison Policy Initiative. Fifteen state prison systems and the Federal BOP have readily available and frequently updated populations counts, including pre-pandemic and mid-to-late April counts. For other state-level prison reforms, see our COVID-19 response tracker here: https://www.prisonpolicy.org/virus/virusresponse.html. *Of note, Vermont is one of six states with a combined jail and prison system. Because of this, we cannot be certain how much of Vermont’s incarcerated population reduction is due to the release of pretrial detainees (who would be in jail in other states) or people sentenced to state prison, which suggests that even the state with most drastic prison population reduction is still too far behind the typical jail.
Prison system
Percentage reduction
Pre-COVID-19 prison population
Most recent prison population
Dates data collected
Vermont*
16.0%
1,649
1,385
3/13/20 & 4/27/20
Maine
7.9%
2,161
1,991
March 2020 & 4/27/20
Utah
7.9%
6,626
6,101
Feb 2020 & 4/27/20
Iowa
3.2%
8,495
8,222
March 2020 & 4/27/20
Kansas
2.5%
10,051
9,797
2/27/20 & 4/27/20
Kentucky
4.3%
12,240
11,708
2/28/20 & 4/27/20
South Carolina
1.9%
18,074
17,735
2/1/20 & 4/27/20
Mississippi
1.7%
20,879
20,519
2/3/20 & 4/1/20
Wisconsin
4.1%
23,471
22,506
2/28/20 & 4/24/20
Oklahoma
3.8%
24,994
24,042
2/24/20 & 4/27/20
North Carolina
3.5%
35,010
33,714
3/31/20 & 4/27/20
Arizona
2.0%
42,282
41,440
2/29/20 & 4/27/20
Pennsylvania
2.8%
44,756
43,500
2/29/20 & 4/27/20
Georgia
3.6%
53,523
51,618
2/28/20 & 4/24/20
California
4.0%
123,105
118,161
2/26/20 & 4/22/20
Federal Bureau of Prisons
2.1%
164,440
160,979
3/5/20 & 4/23/20
Some states’ prison population cuts are even less significant than they initially appear, because the states achieved those cuts partially by refusing to admit people from county jails. (At least Colorado, Illinois, California, and Oklahoma are doing this.) While refusing to admit people from jails does reduce prison density, it means that the people who would normally be admitted are still being held in different correctional facilities.
Other states are indeed transferring people in prison to outside the system, either to parole or to home confinement, but these releases have not amounted to significant population reductions. For example, the Iowa Department of Corrections has released over 800 people nearing the end of their sentences since March 1st, but the overall net change in Iowa’s incarcerated population has only been about 3%. Kentucky Governor Andy Beshear commuted the sentences of almost 200 people convicted of felonies in early April, and the state also planned to release 743 people within 6 months of completing their sentences. But since February, the Kentucky prison population has only decreased by a net 4.35%.
Of the states we analyzed, those with smaller pre-pandemic prison populations appeared to have reduced their populations the most drastically. The prison population has dropped by 16% in Vermont and almost 8% in Maine and Utah. But the median percentage of people released from jails hovers around 20%, still surpassing Vermont’s state prison reduction of 16%.
States clearly need to do more to reduce the density of state prisons. For the most part, states are not even taking the simplest and least controversial steps, like refusing admissions for technical violations of probation and parole rules, and to release those that are already in confinement for those same technical violations. (In 2016, 60,000 people were returned to state prison for behaviors that, for someone not on probation or parole, would not be a crime.) Similarly, other obvious places to start are releasing people nearing the end of their sentence, those who are in minimum security facilities and on work-release, and those who are medically fragile or older.
If the leadership and success of local jails in reducing their populations isn’t enough of an example for state level officials, they may find some inspiration in the comparative success of other countries:
Table 3: Countries reducing their incarcerated populations in the face of the pandemic (showing 13 countries where current population data was readily available)
Table 3. The United States incarcerates more people than any other country, and all U.S. states incarcerate at higher rates than most countries. Countries around the world are recognizing that public safety includes protecting society from the unnecessary spread of COVID-19, and are reducing their prison populations in order to meet that goal. (Release counts collected by Prison Policy Initiative from news stories covering international prison and jail releases. Percentage of reductions calculated by the Prison Policy Initiative based on pre-pandemic populations — including pretrial and remand detainees — from the World Prison Brief.)
Country
Percentage reduction
Pre-COVID-19 prison population
Number released
Dates data collected
Afghanistan
33%
30,748
10,000
2018 & 3/26/20
Turkey
31%
286,000
90,000
2019 & 4/14/20
Iran
29%
240,000
70,000
2018 & 3/17/20
Myanmar
26%
92,000
24,000
2018 & 4/17/20
South Sudan
20%
7,000
1,400
2019 & 4/20/20
The Gambia
17%
691
115
2019 & 4/26/20
Indonesia
14%
270,387
38,000
3/31/20 & 4/20/20
France
14%
72,000
10,000
3/2020 & 4/15/20
Ireland
13%
3,893
503
2018 & 4/22/20
Italy
11%
61,230
6,500
2/29/20 & 4/26/20
Kenya
9%
51,130
4,500
2018 & 4/17/20
Colombia
8%
122,085
10,000
2/29/20 & 3/31/20
Britain
5%
83,189
4,000
3/27/20 & 4/4/20
Prisons and jails are notoriously dangerous places during a viral outbreak, and public health professionals, corrections officials, and criminal justice reform advocates agree that decarceration will help protect both incarcerated people and the larger communities in which they live. It’s past time for U.S. prison systems to meaningfully address the crisis at hand and reduce the number of people behind bars.
We outline five things to keep in mind about crime data trends during the pandemic, including a few tips for where to look for information about your local area.
Crime rates have fallen in recent weeks, with most of the country under “stay at home” orders. As TIME and Bloomberg News have recently reported, cities across the country have seen changes in offense patterns as well as in the number of total crimes reported, with most places showing a significant decrease in overall crime. But crime data analysis isn’t cut-and-dry, so here we outline five things to keep in mind about crime data, including a few tips for where to look for information about your local area.
Local crime trends may vary a lot and appear dramatic: here’s why ⤵
Where to find local crime data, and what questions to ask about it ⤵
1. The types of crimes, and targets of crimes, are changing during the pandemic
Among the crime trends observed during this pandemic are changes in the types of crimes and sites of crimes. Notably, violent crime has dropped, and burglaries have shifted away from home break-ins to target closed businesses instead. These changes make sense in a world where more people are staying home during work hours and on weekends, and most brick-and-mortar businesses are either closed or operating fewer hours and with a fraction of their usual staff. For violent crimes like assault or robbery to occur, people have to come into close contact. And why would someone try to steal from an occupied house when there’s an empty shop downtown? Similarly, car thefts have gone up in a few cities, which is unsurprising when many drivers have little reason to move the car from where it’s been parked for the past month. Experts have weighed in to explain some of the recent crime trends for TIME and Bloomberg, offering similar common-sense explanations; the idea that crime changes as people’s “routine activities” change is also the subject of decades of criminological study.
There are more disturbing changes, likely fueled by the emotional strain of social isolation and collective grief, not to mention the economic strain of a sudden loss of income for millions of people. Some cities have reported an increase in calls related to domestic violence, for example, and with schools closed, children are more vulnerable to abuse and neglect at home. With commerce moved largely online, we may see more internet-based “white collar” crime, such as the new crop of scams reported by the FBI.
For millions of people, the strain caused by this virus will not end when shops open up and people can get together again, and evidence suggests that some crimes may increase because of the looming economic crisis. It will continue to be important to monitor crime trends to see how this pandemic affects Americans, particularly those on the margins, and to recognize that most crimes signal unmet needs that require help, not punishment.
2. Changes in policing will mean fewer arrests and lower crime rates
It’s important to remember that official crime data comes from law enforcement agencies, so it is a record of crimes reported to, or by, police. Therefore, as police practices change, so do crime statistics. This pandemic has impacted police departments in a number of ways: police officers have gotten sick, and officials have directed police to avoid unnecessary contact with the public and even to respond to some offenses differently, such as issuing citations in lieu of arrest. Most of these changes will result in fewer reported crimes, as there are fewer police officers available to patrol the streets, fewer face-to-face traffic and street stops, and fewer arrests overall. So some of the “decrease” in crime is due to changes in policing rather than changes in criminal behavior.
That means that the inverse is also true: when policing returns to “normal,” it’s very likely that reported crimes will go back to previous (historically low) levels. This should not cause alarm, although headlines will undoubtedly shout about a “spike” in crime when that happens. That “spike,” too, will be largely a reflection of police ramping enforcement back up to pre-pandemic levels. We should always be skeptical of short-term changes in crime data.
3. People may be less likely to report crimes, which will also lower crime rates
Not all crimes are reported to police by civilians, even under normal circumstances. The Bureau of Justice Statistics estimates that in 2018, less than half (43%) of violent crime victimizations were reported to police, and an even smaller share (34%) of property crime victimizations were reported. Now that people are avoiding in-person contact for fear of contracting or spreading the coronavirus – even avoiding hospitals when they need them – it’s very likely that even fewer crimes are being reported to police. Victims of rape and sexual assault (crimes that are always underreported) may be even less likely to go to the police and undergo forensic medical exams. And given the heightened risk of infection in prisons and jails, victims of intimate partner violence or other domestic abuse may be even more reluctant to seek police intervention, which is likely to result in an arrest of at least one person, if not both.
As with changes in police practices, when the number of infections falls and people become more comfortable with face-to-face contact, we can probably expect the number of reported crimes to go up again. When that happens, we should be cautious of interpreting that change as an “increase in crime,” when it may largely reflect a return to pre-pandemic crime reporting rates.
4. Local crime trends may vary a lot and appear dramatic: here’s why
Headlines that start with sweeping statements like “Crime Rates Plummet Around the World” obscure important differences in crime data across cities, states, and regions. Just as the impact of the coronavirus looks very different when we look at national versus local infection rates, crime trends become more pronounced, and less consistent, when we look at local data. Part of this is because local conditions affect local crime patterns: in neighborhoods where people go to drink, for example, we might expect to see more assaults at night. And in places under stricter “stay at home” orders, we are likely to see more dramatic changes in crime.
Another reason that crime trends appear more exaggerated at the local level is that when the number of crimes is small enough, even relatively small changes are noticeable in the data. For example, as Bloomberg reported, the number of homicides in Austin was up 25% compared to the same time last year – but this was because of one additional homicide, taking the total count from 4 to 5. So it’s important to look critically at trends described in “percent change” terms, to consider how much actual change it reflects, and to report about the data responsibly.
5. Where to find local crime data, and what questions to ask about it
Almost all law enforcement agencies report crime data to the FBI’s Uniform Crime Reporting (UCR) program. National data summaries have historically been published on an annual basis in the Crime in the United States reports, which also allow readers to access local agencies’ summary data. Now, the UCR program is shifting to quarterly data updates through the FBI’s online Crime Data Explorer tool, and will be phasing out the annual reports this year. The online tool provides more detailed local information (see Boston Police Department (link no longer available), for example), and allows you to look at trends over time. Currently, the UCR data is updated through 2018, but according to the FBI, data from January-March 2020 (the start of the pandemic in the U.S.) will be added in June 2020 to the Crime Data Explorer; it will be updated quarterly thereafter. This will be a key source of timely data that will offer more perspective on crime trends across the country.
In many places, local law enforcement agencies also maintain and publish their own data, which may be more useful and up-to-date for local researchers and journalists. Major cities like New York and Philadelphia, for example, frequently publish timely statistics. New York publishes updated crime and jail data for every county in the state, in fact. It’s worth checking with your local law enforcement agency(s) to see whether they publish crime data regularly, and with any state statistical or research agencies, which may provide insights that the FBI data does not.
When reviewing any local crime data, consider the following questions:
What exactly is being measured? Is it arrests, crimes reported to police, all incidents known to police, calls for service, or something else? Are traffic violations or other low-level offenses included? Are they relevant to the question you’re trying to answer?
What does the baseline – or historical data – look like? What were crime rates (or counts) at the same time last year, and in the years before? Arrests are more common at certain times of the year (i.e. summer), so comparing similar time frames will help narrow down factors that might affect changes in the data. And remember that “percent change” can look very dramatic when you’re starting with a small baseline amount of crime (such as homicides).
If crime has increased, what kinds of crimes have gone up? Noticing that crime rates overall have gone up is not necessarily reason to sound the alarms; this may reflect an increase in non-violent property offenses among people desperate for money in an economic crisis, or problems with substance abuse among people who are experiencing extreme distress. On the other hand, some upticks in reported crime may deserve more attention right now, such as an increase in domestic violence or online scams.
How have local routines changed, and could that affect crime patterns? Are most people staying home? Are businesses downtown closed? Are people leaving cars parked on the street for days on end, when they would normally be moving them frequently? These questions may get at some of the reasons behind any changes in crime patterns.
How have local police practices changed, and could those changes affect the data? Have there been changes in staffing, deployment, priorities, or directives to respond differently to low-level crimes?
The final question we should ask when looking at crime data now is: What can we learn about the criminal justice system from recent changes in crime, or responses to crime? One positive effect of this pandemic experience may be that we see how our criminal justice system might operate differently – now and in the future. The recent crime drop, for example, indicates that counties and states can safely release large numbers of people from prisons and jails without compromising public safety. That fact begs the question: Why were so many locked up in the first place? These are the urgently needed conversations we need to have, and looking critically at crime data in the context of social and policy changes can help us get there.
As cities attempt to reduce their jail populations, they should pay attention to the lesson of NYC’s slow decarceration: Even releasing "low-level offenders" is a complicated process liable to be bogged down by delays.
On March 21st, the Board of Correction of New York City recommended that the city decrease its in-custody population by at least 40%, or over 2,500 people.1 But a full month later, NYC has brought the jail population down from pre-pandemic levels by only 27%. And while NYC may be a model for cities that have done much less, like New Orleans, Miami, and St. Louis2, it is also a cautionary tale for doing so little. The infection rate on Rikers Island remains 5 times higher than that of New York City and over 7 times higher than that of New York State.
The city could bring down the infection rates in jails by releasing more people: A smaller jail population allows for physical space for social distancing and quarantining, reduces the burden on correctional healthcare staff, allows for accommodations for staff sick leave, and slows viral transmission both within the jail and to the community at large.
While all incarcerated people should be considered for release, it’s particularly shocking that NYC has been slow to release people held on “technical violations” of parole — that is, for infractions that are not even crimes. As of April 22nd, there were still 293 people held in NYC jails for technical parole violations:
The number of people held for technical violations has declined, but not as fast as it should have. The number of people held for technical violations on March 21st is from the Board of Correction’s letter to NYC DOC. The statistics for April 1st through April 22nd are published by the NYC DOC in daily reports to the Board of Correction. Data on the number of people held for technical violations of parole between March 21st and April 1st — when the DOC began their daily reports — are not available in a compatible format.
Date
Total held on a technical parole violation (with no open case)
Apr 22
293
Apr 21
306
Apr 20
305
Apr 19
303
Apr 18
303
Apr 17
328
Apr 16
339
Apr 15
336
Apr 14
357
Apr 13
391
Apr 12
(no data, weekend)
Apr 11
(no data, weekend)
Apr 10
427
Apr 9
454
Apr 8
486
Apr 7
494
Apr 6
493
Apr 5
(no data, weekend)
Apr 4
(no data, weekend)
Apr 3
490
Apr 2
544
Apr 1
547
Mar 22 – Mar 31
(data not available)
Mar 21
666
There are a few reasons to be surprised by the number of people still jailed for technical violations in New York City. First is that it seems to run contrary to Governor Andrew Cuomo’s March 27 order that 1,100 people incarcerated for technical violations in New York state — including 600 in NYC jails alone — be considered for release. Second is that the city is facing significant pressure to release people held on technical violations, not only from community advocates, but from authorities within the parole system. (In early March, a coalition of current and former community supervision executives called for the nationwide suspension of arrests for technical probation and parole violations.)
It’s not clear who is responsible for holding up the release of people held on technical violations — city officials, state parole officials, judges, or some combination of the three. But what is clear is that this failure to act quickly will make it much harder to reduce the dangerous conditions in New York City jails, leading to more coronavirus infections and deaths. These deaths will disproportionately be people of color, who are overrepresented among technical parole violation detainees in the city’s jails.
But as other state and local governments attempt to reduce the number of people held for these minor violations, they should pay attention to the lesson of NYC’s slow decarceration: Even releasing “low-level offenders” is a complicated process liable to be bogged down by delays. State parole officials, city correctional leaders, judges, prosecutors, and other decisionmakers all must cooperate in order for hundreds or thousands of people to be released in a short time frame. During a pandemic, any of these officials holding up the release process will mean more deaths.
This graphic and data is from the Council of State Governments Justice Center’s invaluable report Confined and Costly: How supervision Violations Are Filling Prisons and Burdening Budgets. (In a technical note, the CSG explains that data is from 2017 exception for Virginia which is from 2016, and that technical breakdown was not available for CT, GA, MA, MD, MI, MN, NC, NH, NM, OK, and PA. Data on violations as a proportion of prison admissions was not available for DE and VT.) The report notes, helpfully, that “variation in these proportions across states is shaped by the overall size of each state’s supervision population, how violations are sanctioned, whether those sanctions are the result of incarceration paid for by the state or county, and how well state policy and funding enable probation and parole agencies to employ evidence-based practices to improve success on supervision.”
Footnotes
The NYC Board of Correction recommended over 2,500 people be reviewed for release in a March 21st letter to the city’s district attorneys and chief judge, the NYC DOC, and the NYS DOCCS. According to the Vera Institute for Justice, the NYC jail system held a total of 5,447 people on February 29th, 2020.
The table below shows the population reductions of the largest jails in the U.S. (those with pre-pandemic populations of over 500 people). This table was compiled using the Vera Institute for Justice’s jail population tool. Of note, we only compared large jails with pre-pandemic population data from January and February 2020.
Problems with data collection - and an unfortunate tendency to group Native Americans together with other ethnic and racial groups in data publications - have made it hard to understand the effect of mass incarceration on Native people.
The scarcity of data on Native Americans in the U.S. criminal justice system comes up a lot in our conversations with activists and reporters, who rightly wonder why Native populations are often excluded from comparisons with other racial and ethnic groups. While Census data reveals that Native populations are overrepresented in the criminal justice system, other information that could shed more light on the issue is sparse. So, we compiled the information that does exist — which is fractured and hard to locate — in one place below.
Preface: What the Census data says
We’ve previously used data from the 2010 Census to analyze incarcerated populations by race/ethnicity and sex for each state. In our analysis, data on prisons and jails were combined. We found that, in 2010, there were a total of 37,854 American Indian/Alaskan Natives in adult correctional facilities, including 32,524 men and 5,132 women (and 198 who were 17 or younger). That is equivalent to a total incarceration rate of 1,291 per 100,000 people, more than double that of white Americans (510 per 100,000). In states with large Native populations, such as North Dakota, American Indian/Alaskan Native incarceration rates can be up to 7 times that of whites. Once the 2020 Census data is released, we will update our analysis, since it is 10 years old now.
Other data on Native Americans in the criminal justice system
Prisons: In 2016, 19,790 Native men and 2,954 Native women (22,744 total) were incarcerated in U.S. state and federal prisons, according to the Bureau of Justice Statistics’ (BJS) National Prisoner Statistics (NPS) series. The NPS series reports the population of state and federal prisons – but not local jails – by race/ethnicity and sex, but the most recent data available with that level of detail is from 2016. However, other sources supplement these findings:
BJS reports an increase to 23,701, in Prisoners in 2017. Oklahoma tops the list as the state with the highest number of American Indian/Alaskan Natives incarcerated, followed by Arizona, Alaska, and California. However, this data is not broken down further by sex and race.
Limited state-level data is also available from some state Departments of Corrections, like Alaska’s, which identifies Alaskan Native populations in its annual Offender Profile. However, many other states, even those with large Native populations like California and Texas, group these populations into an “other” category when reporting demographics. (More on that in our discussion of data limitations below.)
Jails: The BJS annual report on jail inmates estimates 9,700 American Indian/Alaskan Native people – or 401 per 100,000 population – were held in local jails across the country as of late June, 2018. That’s almost twice the jail incarceration rates of both white and Hispanic people (187 and 185 per 100,000, respectively). Frustratingly, this data is also not reported by sex.
The 2016 BJS Jails in Indian Country report identifies 80 facilities operating on tribal lands, holding 2,540 people – 1,750 men and 620 women – in mid-2016. The number of inmates admitted to Indian country jails was 9,640 during the month of June 2016, giving us an idea of “jail churn” in facilities on tribal lands. Additionally, this report is one of the very few sources for this population’s offense data, although even here, about 35% of offenses are unhelpfully categorized as “other.”
Youth: People under the age of 21 make up 42% of American Indian/Alaskan Native populations in the United States, so Native youth confinement is a special concern. With a detention rate of 255 per 100,000 in 2015, Native youth are approximately three times more likely to be confined than white youth (83 per 100,000). In Indian country jails, approximately 6% of the confined population was 17 or younger in 2016; unfortunately, the number of youth held in other adult prisons and jails is not broken down by race/ethnicity. The Census of Juveniles in Residential Placement reports data on Native youth in juvenile justice facilities across the U.S., most recently for 2017, including details about offense type, facility type, sex, age, and more.
Contributing to these confinement rates is disproportionate police contact: Native youth are arrested at a much higher rate than white youth. The 2018 arrest rate for Native youth was 2,251 per 100,000 while white youth were arrested at a rate of 1,793 per 100,000.
Data collection from Native populations suffers from a number of limitations
Data collection efforts in tribal communities face a number of problems that limit the data’s accuracy and comprehensiveness.
According to the National Institute of Justice, issues such as difficulty in outreach, overlapping jurisdictions, and differences between tribal justice systems make the collection of data from these communities especially challenging. U.S. government policies and priorities also limit the data it collects and reports about Native populations:
The DOJ has moved slowly: A Department of Justice (DOJ) oversight report in compliance with the 2010 Tribal Law and Order Act (TLOA) states that the “TLOA requires the Department’s BJS to collect data related to crimes in Indian country. However, 7 years after TLOA became law, its data collection and reporting efforts are still in development.”
Reporting is voluntary: According to the same report,“…because participation in the FBI’s Uniform Crime Reporting (UCR) Program is voluntary, not all tribes report crime statistics into the UCR database. As a result, Indian country crime statistics are so outdated and incomplete as to be virtually useless.” The BJS derives most of its crime data from the UCR program, which is especially incomplete when it comes to tribal jurisdictions’ data. The DOJ report found that while “207 tribes reported to the UCR in 2014, only 115 tribes submitted complete information that was included in the final UCR report.” It’s worth mentioning that there are, as of 2017, 226 tribal law enforcement agencies recognized by the federal government. Assuming the same number existed in 2014, that means 19 (8%) did not report crime data at all.
Data collection does not distinguish between tribes: According to the DOJ report, the National Crime Victimization Survey “does not allow the calculation of separate crime statistics for each American Indian tribe.” A report from the United States Sentencing Commission’s Tribal Issues Advisory Group also cites a lack of accurate databases in tribal courts, consistent and comparable disaggregation, and data sharing between federal and tribal entities.
Data aren’t used to help Native communities: The U.S. Sentencing Commission’s Report notes that the limited data that is collected has not been used to “evaluate and improve” law enforcement activities in Indian country. This adds to the strain caused by the general lack of cooperation between U.S. and tribal justice systems: According to a report by the National Tribal Judicial Center, federal and state correctional facilities “do not notify tribes of inmate release to parole or probation.” The report notes that tribal “protection orders are not validated by or enforced by state courts or state law enforcement. No outside agencies honor tribal court subpoenas.” This lack of reciprocity worsens the already countless issues with data collection and sharing.
Cultural and socioeconomic barriers lead to undercounting: More broadly, a “distrust of the U.S. government, a youth-heavy population, nontraditional addresses, low internet access, language and literacy barriers, weather and road access issues, and high rates of poverty and houselessness” create a deeply problematic undercounting of American Indian/Alaskan Native people. (A report by Rewire.News examines the consequences of this undercounting, including lower representation in Congress, funding deficits in health and human services, and a decline in tribal recognition and enrollment.)
“Other” data obscurities
Criminal justice data often uses racial and ethnic categories to break down the disproportionately high representation of Black and Hispanic populations in prisons and jails. Beyond these categories, however, lies the illusive “other” designation, which lumps together Asian Americans, Pacific Islanders, Native Hawaiians, and of course, American Indians and Alaskan Natives. However, as the Census data reveals, disproportionate incarceration rates for these groups are not negligible. This practice obscures differences between these groups and makes it difficult to determine how the justice system plays a role in Native communities. Specifically:
The Bureau of Justice Statistics categorizes American Indian/Alaskan Natives as “other” in their Felony Sentences in State Courts data series. According to research by the Native American Voting Rights Coalition, several Native women surveyed mentioned that their husbands/partners were ineligible to vote due to felony convictions, contributing to a variety of barriers that hinder Native American political participation. The lack of disaggregated data makes it difficult to determine the exact proportion of Natives who are disenfranchised.
According to the American Indian and Alaskan Natives in Local Jails report, there were 56,400 individuals in jails – in addition to those categorized as “single race” American Indian/Alaskan Native – who identified as American Indian/Alaskan Native and another race(s) or ethnicity, suggesting higher rates of incarceration nationwide if multi-racial individuals were included in Native population counts or rates.
Rewire.News’s report also highlights how gender categorization of Native populations can often obscure those who identify as Two Spirit, non-binary, or transgender.
As it stands, there are many more questions than answers about Native Americans in the criminal justice system. Until criminal justice agencies overcome the limitations on data collection — and until the offices that publish the data are willing to list Native Americans as a distinct demographic group, rather than a member of an “Other” category — informational gaps will continue to make it difficult to understand how overcriminalization has impacted Native populations.
Many local jails and pretrial systems are taking action to reduce their populations in advance of the COVID-19 pandemic, but state prison systems are not, raising the question: Are state prisons prepared to handle a pandemic within their walls? We set out to survey prison systems on the capacity of their health facilities, their plans for any necessary external hospitalizations, their levels of equipment, their staffing levels and their general priorities.
Unfortunately, our April 3-10 survey shows that state prisons are still largely unprepared for a global pandemic that can reasonably be expected to hit their entire state prison system — and their supporting state government — all at the same time.
Most prisons are still aiming to keep the virus out of their facilities, rather than focusing on how to minimize the harm to incarcerated people, to their staff and to society as a whole. Containment might be a reasonable goal when it comes to outbreaks of flu, tuberculosis, or MRSA – diseases that prison systems know how to guard against by vaccinating people, screening, and so on. But COVID-19 is different both in terms of how it spreads and by the fact that it is already stressing the public hospital system that state prisons historically rely on for back-up support.
Given the number of large number of staff required to run a facility1 and the apparent ease with which asymptomatic people can infect others, no combination of security restrictions — such as suspending family visitation, checking the temperature of incoming staff, or confining the entire population to their cells — can keep out the virus that causes COVID-19 for long.2 And once the virus enters a facility, the density and lack of sanitation will allow it to spread quickly to all incarcerated people and staff, and will accelerate the spread to the surrounding community.
Ideally, state prisons’ first response to the pandemic should have been to do like many jails and reduce the number of people incarcerated. But at the very least, we expected to see them developing plans that acknowledged the inevitability of a COVID-19 outbreak and its unique challenges. Their plans should anticipate the need to isolate vulnerable people, work around staffing shortages, and navigate shortages of medical supplies and hospital beds. But except for a few notable exceptions — particularly North Dakota — most states have not even gotten that far.
The good news is that in some states, the spread of the virus is several weeks behind other states, so some of the states that are the least ready still have the potential to learn from other states and improve their planning.
The state of pandemic planning in state prisons
In our survey of state Departments of Corrections, we sought to gather more information about how states are preparing for the pandemic to breach the prison gates. We asked about five major topics of pandemic preparedness:
the capacity for isolating particularly vulnerable individuals and quarantining people with suspected cases of COVID-19 within facilities,
protocols for people requiring hospitalization,
equipment (including ventilators, medical-grade PPE, COVID-19 tests) accessible to facilities,
anticipated staffing changes and availability of healthcare staff within facilities, and
what the most immediate priorities are in planning for a COVID-19 outbreak in correctional facilities.
We hoped to hear from each state that steps were being taken to prepare facilities to navigate the inevitable: a positive COVID-19 test among the hundreds of people living in close proximity to one another in prison. We expected each facility to have designated cells, units, or wings that could be easily isolated from the rest of the facility to allow either isolation of people who are particularly vulnerable to complications from COVID-19, or quarantine of people who test positive for COVID-19.
Given the recommendation from expert Dr. Homer Venters that facilities establish a plan for hospitalizations that recognizes that staff will be in short supply, and thus does not require the usual 2:1 ratio of correctional officers to patients, we expected correctional departments to have established new pathways and protocols for hospitalization.
We also expected that because prisons have finite resources for respiratory support (such as oxygen), facilities would have realistic plans to transfer people to hospitals while protecting staff from exposure. We hoped prisons could tell us how they would secure sufficient equipment and supplies, and how they will respond when supplies run out or when hospitals refuse to admit. (For example, there is already a shortage of COVID-19 tests, restrictions on who can be tested, and personal protective equipment (PPE) for medical professionals is already in short supply.) This planning, unfortunately, was largely absent.
Given the rate of infection and the length of hospitalization for severe cases of COVID-19, it is reasonable to assume facilities will encounter staffing shortages and that plans need to be in place for making sure the essential services behind bars continue in the face of staff calling out sick (i.e. food, medical care, telephone access, etc.). Given that most correctional staff are already stretched thin, departments should have begun planning for a staffing shortage weeks ago by reducing the number of people incarcerated and reducing the burden on staff. Most departments did not, but we still expected that they were preparing for the medical challenge created by that inaction.
The responses we received were largely disappointing. Rather than developing plans to mitigate the harm of an inevitable outbreak, most states are still focusing on restricting the movements of incarcerated people within facilities — in other words, attempting to “contain” the virus, which is all but impossible with COVID-19.
Even worse, some state departments of corrections informed us that no changes to their existing medical capacity were needed, suggesting that their established medical facilities and staff were sufficient to combat a disease that is overwhelming entire city infrastructures across the nation. Other states notified us that because no positive cases had occurred in their prisons, many changes have not yet been implemented. A number of states referred us back to their websites, which although providing up-to-date information on some aspects of their COVID-19 response, did not answer the specific questions about policy and planning changes in the past few weeks.
The good news is that many states still have time to do a far better job. At this point, on April 10, state Departments of Corrections need to be focused on mitigating the disastrous consequences of the COVID-19 pandemic entering prisons, rather than sticking to the belief that their high prison walls can effectively keep a global virus at bay.
Footnotes
Every facility is different, but outside observers can roughly estimate the number of staff that go in and out of a facility by dividing the incarcerated population by 4.6 for jails and 4.7 for prisons. (The typical jail has one staff member for every 3.3 incarcerated people, and the typical prison has one staff member for every 3.4 incarcerated people. If you assume that the staff work 5 days out of 7, you can divide the incarcerated population by 4.6 or 4.7 to get an estimate of how many staff enter and leave the facility every 24 hours.)
We are separately tracking press releases and updates from state departments of corrections on visitation suspension, changes in communication costs, screening policies for staff and new admissions, and facility lockdowns. ↩
To protect the American public from COVID-19, schools have closed, non-essential stores have been shuttered, people with desk jobs have started working from home, and public gatherings have been prohibited. But the prison system continues to hum along as though nothing has changed: Prisons have done virtually nothing to reduce the population density that puts both incarcerated people and staff at grave risk.
To justify their lack of action, criminal justice officials and elected leaders imply that saving the lives of people behind bars is not worth the inevitable public safety cost of releasing them. This talking point is as old as time. It’s also out of step with history.
Large-scale releases have been common throughout U.S. and international history for a variety of legal, political and health reasons. Below is a partial and non-exhaustive summary of some notable examples in U.S. and international history. (These examples were originally collected for a different project with Leah Sakala in 2014.)
If the places where these releases took place became hotbeds of crime, we’d know about it already. But they didn’t. In fact, in many cases, the inverse happened — and the academic literature about these experiences prove it.
SELECTED HISTORICAL DECARCERATION EXAMPLES
U.S. examples
California (adults, 1968 – 1972) Between 1968 and 1972, while Ronald Reagan was the tough-on-crime Governor of California, the state’s incarceration rate dropped from 146 to 96 per 100,000. The historical record suggests that the decrease was largely due to a state program to incentivize local probation departments to decrease commitments to state facilities, as well as an increased use of parole.
California (youth, 1996 – 2009) Although California is currently struggling politically with reducing its adult population, that state is a national leader on reducing its incarceration of kids. Previously, the Youth Authority was a “catch-all” for even the lowest-level offenders. Among other reforms, the state has created financial disincentives for counties to send kids to the state system while rewarding them if they kept the kids in local programs.
California (currently) Beginning in 2006 and accelerating in 2009, the California prison population has been dropping. Spurred in part by the Supreme Court’s order in Plata, major changes are underway (although far less than most of us hoped and far less than most of our opponents feared.) Some of the drop in the prison population is the illusory result of “Realignment,” a legislative change that sends people who would previously have gone to state prison to local jails. The California prison population drop is still notable because the state’s prison population is dropping faster than the jail population is increasing, but the actual decline in the number of people incarcerated in California is not as large or as quick as the Supreme Court ordered.
Florida (1963 – 1965) On the heels of the Supreme Court’s Gideon v. Wainwright decision, Florida had to give thousands of incarcerated people new trials, this time with court-appointed lawyers. For some people, the evidence was too flimsy or dated to withstand a proper legal defense, so over 1,000 people were released in a very short time period.
Illinois (1980 – 1983) Concerned that the 1978 legislative switch to “determinate” sentencing would lead to prison overcrowding, the Department of Corrections instituted a special program of the parole board awarding extra good time credits. In sum, over 21,000 people, or 60% of all prison releases, were released an average of 105 days early.
Massachusetts (youth, 1969) Massachusetts, under Republican Governor Frank Sargent and newly-appointed Department of Youth Services Commissioner Jerome Miller, closed its training schools for kids and decarcerated nearly 900 children. The state paroled some children directly home while a new system of community-based alternative programs were developed.
New York & New Jersey (~1999 – present) A mix of reforms — including policing, sentencing reform and parole — have allowed these two states to radically reduce both the number of people entering prison and how long they are incarcerated. Governors of both parties implemented these reforms at a time when the prison population was still rising nationally. In fact, much of the national prison drop in recent years is the result of these two states plus California.
Washington State (1979-1984) Over 1,600 people were released early in six different periods over the course of five years.
International examples
Czech Republic (2013) Outgoing President Václav Klaus gave a mass amnesty/pardon to over 6,000 people, approximately one third of the incarcerated population, as a way to both respond to an overcrowding crisis and to mark the anniversary of Czech Independence. “The president pardoned all convicts with prison terms under one year. The amnesty… also includes people sentenced for non-violent crimes to up to two years in jail, and seniors aged at least 70 whose prison terms do not exceed three years and those aged at least 75 with terms of up to 10 years.”
Finland (1976 – present) Finland used to have one of the highest incarceration rates in Europe. Finland made a long series of policy changes — including decreasing sentence lengths — to radically lower their use of the prison, and that country now has one of the lowest incarceration rates in the entire world.
Source: Nils Christie, Crime Control as Industry.
Israel (1967) The Israeli Knesset passed an Amnesty Law that released 501 incarcerated people and closed 15,376 criminal investigations.
Italy (2006 and 1990) In 2006, to respond to prison overcrowding, the Italian government released 22,000 people, generally those serving three years or less, except for those convicted of Mafia-related crimes, terrorism, sexual violence or usury. An earlier mass pardon in 1990 released 8,451 people out of the total incarcerated population of 26,000.
Russia (numerous, late 1990s through present) Russia has repeatedly issued large-scale amnesties, used both to manage the populations and to celebrate key events like the 20th anniversary of the constitution. Some amnesties also applied to people with pending charges. One notable and major large-scale amnesty was in 1999, when incarcerated people were released to help control a tuberculosis epidemic that was incubating in the prisons and then spreading to the rest of the country.
To accompany our work on what the criminal justice system is doing — and should be doing — to respond to the COVID-19 pandemic, the Prison Policy Initiative today released a spreadsheet showing what each state Department of Corrections has told the public about its virus response plan. Prepared for internal use, we’re sharing it in the hopes it will save other advocates, journalists and policymakers time looking up the same information.
The spreadsheet includes:
Links to each state’s COVID-19 page or its archive of press releases
Links to the infection and fatality trackers for each state (about half of all states have this)
Notes on whether each state is addressing 15 separate topics, including the suspension of visits, changes in telephone policies, increased access to hygiene materials, employee screening, staffing changes, isolation plans, etc.
This spreadsheet is a useful view into what the state prison systems see as important to communicate to the public, although it is not necessarily the definitive statement on what state prisons are doing. (For example, some states may think that suspending unaffordable medical copays during a global pandemic was too obvious to announce, and other states may be planning to accelerate parole releases but are choosing to be quiet about it. By the same token, states that are stubbornly refusing to change their copay policies,1 for example, are predictably not going to trumpet that fact on their websites.)
Other advocates looking for information on what state prison systems are doing should look at:
Professor Sharon Dolovich at the UCLA School of Law has shared a growing comprehensive spreadsheet including results from a state-by-state survey of changes in visitor policies, requests for population reduction, and actions taken to reduce the incarcerated population.
We will continue to update the spreadsheet as long as we find it useful internally, and the spreadsheet will always have the last modified date at the top.
Footnotes
We are looking at you, Delaware, Hawaii, and Nevada. ↩
The report includes an interactive map showing where people convicted of violence have been "carved out" of recent criminal justice reform laws.
April 7, 2020
As the threat of a COVID-19 disaster in U.S. prisons looms, people serving time for violent crimes may be most at risk, as states like California and Georgia exclude them from opportunities for rapid release. “Violent offenders” — even those who are old and frail — are being categorically denied protection in a pandemic.
Letting people convicted of violence apply for life-saving opportunities requires political courage, just as it has for decades. But denying relief to people based exclusively on their crime of conviction is as ineffective as it is unjust. In a new report,Reforms Without Results, we review the existing research on violent crime, explaining six major reasons why states should include people convicted of violence in criminal justice reforms:
Long sentences do not deter violent crime.
Most victims of violence, when asked, say they prefer holding people accountable through means other than prison, such as rehabilitative programs.
People convicted of violent offenses have among the lowest rates of recidivism — belying the notion that they are “inherently” violent and a threat to public safety.
People who commit violent crimes are often themselves victims of violence, and carry trauma that a prison sentence does nothing to address.
People age out of violence, so decades-long sentences are not necessary for public safety.
The health of a person’s community dramatically impacts their likelihood of eventually committing a violent crime — and community well-being can be improved through social investments rather than incarceration.
Demonstrating how common it is for people convicted of violence to be left behind, our report includes an interactive U.S. map showing 75 examples of state criminal justice reform laws that have excluded them. The map reveals that:
At least 16 states have passed laws excluding people convicted of violent crimes from veterans’ courts, mental health courts, diversion programs, and other alternatives to incarceration.
In at least 10 states, people convicted of violent crimes have been “carved out” of laws designed to ease the reentry process.
At least 20 states have passed laws that expand parole, good time, and other mechanisms for early release — but offer no relief to people convicted of violent offenses.
Unless states are willing to change how they respond to violence, reducing U.S. incarceration rates to pre-1970s levels will be impossible: Over 40% of people in prison and jail are there because of a violent offense. Lawmakers serious about ending mass incarceration — or limiting the toll COVID-19 takes behind bars — can no longer afford to ignore people serving time for violent crimes. In Reforms Without Results, we provide the data and arguments they will need to craft more courageous and effective criminal justice reforms.
Jails and prisons are often overcrowded, and their residents are disproportionately likely to have chronic health conditions that make them especially vulnerable to viral infections. So as the COVID-19 pandemic unfolds, we’ve been asked: Is social distancing (as recommended by the CDC and other public health agencies) even possible behind bars? Can incarcerated people maintain 6 feet from each other, and from correctional officers and other staff?
In short, the answer is no.
To answer this question, we looked at how the physical space of jails and prisons compare to that of cruise ships and nursing homes, two of the most prominent incubators of the virus.
The Grand Princess and Diamond Princess, two cruise ships implicated in the outbreak of COVID-19 in the United States, have typical cabins that range from 73 to 79 square feet per person (with furnishings like beds, dressers, chairs, desks, and tables).
And generally, any shared bedroom in a nursing home is required to have 80 square feet of space per resident (including necessary furnishings, like a bed, dresser, table, and chair).
We found that incarcerated people are living in quarters that are similarly sized, if not smaller. According to the American Correctional Association (ACA), cells in correctional facilities should have at least 25 feet of space per person in each cell that are “unencumbered,” meaning they are not taken up by the bunk, desk, or other furnishings.
That’s a 5X5-foot space for each person, leaving almost no room for maneuvering while maintaining the recommended 6 feet of distance between people. And we know that in some facilities, beds can be as close as 3 feet apart.
COVID-19 is hammering cruise ships and nursing homes because social distancing is impossible. Incarcerated people are living in comparable if not smaller quarters, but with a notable difference: On cruises and in nursing homes, people have in-room access to the necessary hygiene products and water – something that is often missing in correctional facilities.
We’re already seeing the appalling result in city and county jails nationwide, most notably on Rikers Island in New York City, where the coronavirus infection rate is already nearly 8 times higher than the rest of the city.
Incarcerated people are disproportionately affected by underlying health conditions known to exacerbate COVID-19, and social distancing is impossible. There is no time to waste: State and local governments must take swift action to reduce prison and jail populations.
For our virus response tracking and other jurisdiction-specific information, see our virus response pages.
March 19, 2025: Join Prison Policy Initiative’s Advocacy Department at 1 PM EST on Wednesday, March 19, 2025, for a webinar about understanding recidivism. We will cover strategies from our recidivism toolkit, including an overview of recidivism statistics and what they really mean, how to combat the “Willie Horton” effect, and ways that advocates can transform the narrative around reentry to make it less focused on negative outcomes and more focused on the ways that returning citizens contribute to their communities.


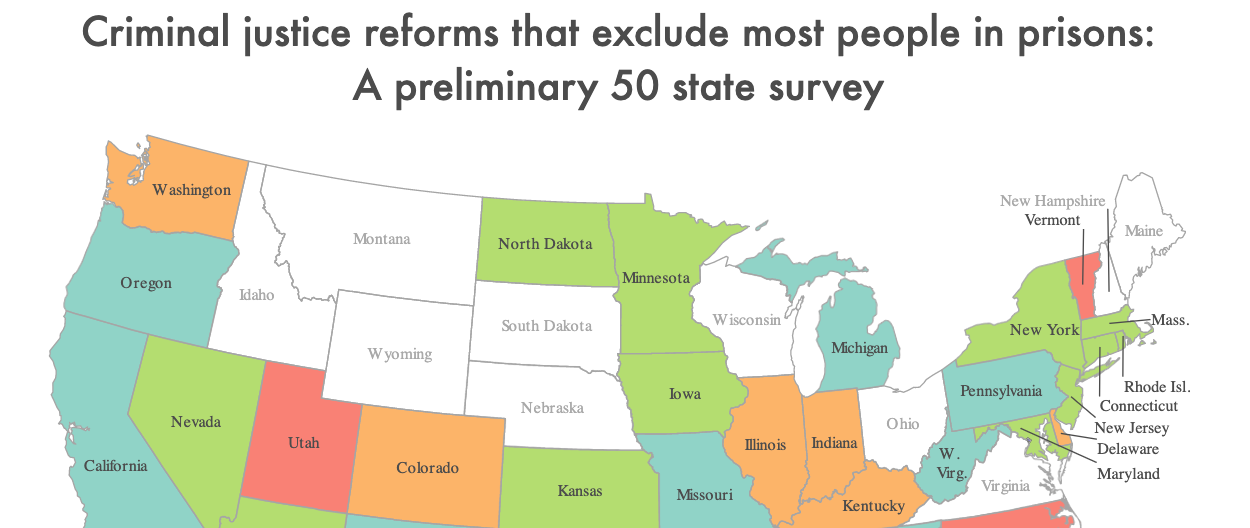


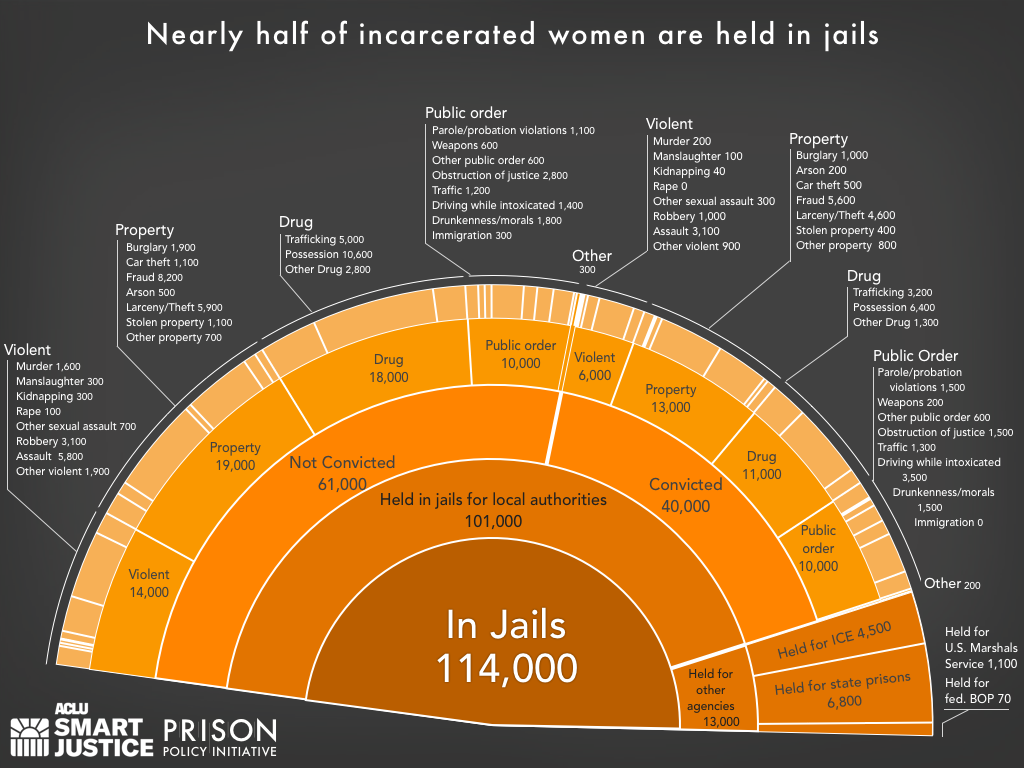