March 19, 2025: Join Prison Policy Initiative’s Advocacy Department at 1 PM EST on Wednesday, March 19, 2025, for a webinar about understanding recidivism. We will cover strategies from our recidivism toolkit, including an overview of recidivism statistics and what they really mean, how to combat the “Willie Horton” effect, and ways that advocates can transform the narrative around reentry to make it less focused on negative outcomes and more focused on the ways that returning citizens contribute to their communities.
The government hasn’t collected national data on the race or ethnicity of people awaiting trial in jail since 2002. We review the academic literature published since then to offer a more current assessment of racial disparities in pretrial detention.
Being jailed before trial is no small matter: It can throw a defendant’s life into disarray and make it more likely that they will plead guilty just to get out of jail.1 As advocates bring national attention to these harms of pretrial detention, many places – most recently New Jersey, California, New York, and Colorado – have passed reforms intended to dramatically reduce pretrial populations.
But it’s not enough to simply bring pretrial populations down: Another central goal of pretrial reform must be to eliminate racial bias in decisions about who is detained pretrial and who is allowed to go free. Historically, Black and brown2 defendants have been more likely to be jailed before trial than white defendants. And recent evidence from New Jersey and Kentucky shows that while some reforms have helped reduce pretrial populations, they’ve had little or no impact on reducing racial disparities.
As of 2002 (the last time the government collected this data nationally), about 29% of people in local jails were unconvicted – that is, locked up while awaiting trial or another hearing. Nearly 7 in 10 (69%) of these detainees were people of color, with Black (43%) and Hispanic (19.6%) defendants especially overrepresented compared to their share of the total U.S. population. Since then, pretrial populations have more than doubled in size, and unconvicted defendants now make up about two-thirds (65%) of jail populations nationally. With far more people exposed to the harms of pretrial detention than before, the question of racial justice in the pretrial process is an urgent one – but the lack of national data has made it hard to answer.
While pretrial jail populations have grown to make up almost two-thirds of jail populations nationally, and Black and Hispanic defendants were overrepresented in the 2002 population, no national data have been collected since then to assess how racial disparities may have changed.
So what, exactly, is the state of racial justice in pretrial detention? And how can advocates assess racial justice in their county or state? What data do they need, and where can they find it? This briefing reviews findings from recent studies of racial disparities in pretrial decisions – including both national and more geographically-limited analyses – and then suggests sources for further research to understand and address the problem.
To assess the state of racial justice in pretrial detention since the last national survey was conducted nearly 20 years ago, I reviewed more recent academic literature – studies that utilize other data sources and offer more nuanced analysis.
Overall, the available research suggests that:
In large urban areas, Black felony defendants are over 25% more likely than white defendants to be held pretrial.
Across the country, Black and brown defendants are at least 10-25% more likely than white defendants to be detained pretrial or to have to pay money bail.
Young Black men are about 50% more likely to be detained pretrial than white defendants.
Black and brown defendants receive bail amounts that are twice as high as bail set for white defendants – and they are less likely to be able to afford it.
Even in states that have implemented pretrial reforms, racial disparities persist in pretrial detention.
National data is limited and outdated
Only one publicly-accessible study uses a nationally representative sample to measure pretrial detention status by race: the Survey of Inmates in Local Jails (SILJ), which was last conducted in 2002. Considering that jails and policing practices have changed significantly since 2002, an update to this dataset – now slated for 2021 – is long overdue.
Since 2002, national studies have been limited to felony cases in large urban counties. These studies are based on the Bureau of Justice Statistics’ (BJS) State Court Processing Statistics (SCPS), data which were last collected in 2009. The data include both demographic and case characteristics for each defendant, allowing researchers to control for legally-relevant factors like offense type, number of arrest charges filed, prior criminal record, and whether the defendant had failed to appear in court before. While BJS’ own publications based on this dataset (the Felony Defendants in Large Urban Counties series) do not provide a breakdown of pretrial detention by race or ethnicity, some academic researchers have used it for that purpose. (For a full list of their studies, see the appendix to this article.)
These national studies of felony cases in large counties generally conclude that the direct impact of race on pretrial decisions is weak, but that racial bias acts cumulatively to affect outcomes, and indirectly via factors like ability to pay for bond or a private attorney. McIntyre & Baradaran’s analysis of 1990-2006 SCPS data concludes that Black defendants are over 25% more likely to be held pretrial than white defendants. The most recent SCPS data, from 2009, supports that finding: Even after controlling for age, gender, and a number of conceivably legally-relevant factors (most serious charge, prior arrests, etc.), Dobbie & Yang (2019) find that over half (58%) of the 39 sampled counties had higher rates of pretrial detention for Black defendants than for white defendants. In 5 counties, the unexplained racial gap was over 20%.
More recent, but geographically-limited, studies help fill in the gaps
More recent analyses shed further light on racial justice in pretrial decision-making, even though their samples are not nationally representative. I looked at 16 of these more geographically-limited studies, with subjects ranging from federal drug cases in the Midwest to misdemeanor cases in Harris County (Houston), Texas. In all, they include samples from 11 states spread across the U.S., and major cities including New York City, San Francisco, Philadelphia, and Miami.
Of course, no single estimate of racial disparity in pretrial detention will apply to all counties nationwide. In the studies I reviewed, the racial gap in pretrial detention between Black and white defendants ranges widely, from about 10% to 80% depending on the study and jurisdiction (that is, the county or city).
However, these studies most frequently confirm that unexplained racial disparities continue to plague the pretrial process.3 Throughout the literature, researchers report that rates of pretrial detention and receiving financial conditions of release (i.e. money bail) are consistently higher for Black and Latinx defendants (and often Native American defendants, when they are included in the analysis). Bail bond amounts, too, are consistently higher for Black and brown defendants, even though they are less able to afford money bail. Rates of release on recognizance or other nonfinancial conditions of release, such as pretrial supervision, are likewise lower for Black and brown – versus white – defendants. Furthermore, the studies that included sex and age in their analysis found that young Black males face the greatest disadvantages.
Specifically, these studies report significant racial disparities, such as:
Most of these studies find that Black and brown defendants are 10-25% more likely to be detained pretrial or to receive financial conditions of release.
Median bond amounts, when compared, are often about $10,000 higher for Black defendants compared to white defendants. In at least one study, the median bond set for Black defendants was double the median bond set for white defendants.
The most recent analyses of racial disparities in pretrial detention – assessing the effects of reforms in New Jersey and Kentucky – show that pretrial assessment tools have not reduced these disparities as much as advocates hoped. After New Jersey essentially ended the use of money bail for most defendants in 2017, the total pretrial population dropped significantly, but the racial composition of the pretrial jail population changed very little. And in Kentucky, the racial disparity in pretrial release rates actually worsened after the state enacted a law requiring the use of a pretrial assessment tool.
Advocates may be able to find data about their local jails
Of course, county or city jail administrators may collect and maintain data on the racial/ethnic composition of their pretrial populations. Advocates in some jurisdictions may be able to request data about their own local pretrial jail populations, which they can compare with the overall local population for a simple measure of racial disparity. Such a comparison, however, will exclude other relevant characteristics (such as seriousness of offense or past failures to appear in court) and won’t identify what stage(s) of pretrial decision-making are affected by race (such as the decision to set a money bail amount, or how high bail was set). Nevertheless, even a crude estimate of racial disparity in local pretrial detention can help advocates draw attention to the issue and raise important questions with decisionmakers.
Where to look next for more data
Jailing Black and brown pretrial defendants more often than white defendants isn’t just unfair; it also contributes to racial disparities later in the justice process. But in order to solve this problem, local advocates and policymakers need current data about who is held pretrial in their counties and states. And in order to identify broader patterns in pretrial decision-making, we need more data at the national level as well.
Until the Bureau of Justice Statistics updates its Survey of Inmates in Local Jails – which, unfortunately, is not guaranteed to happen on schedule in 2021 due to chronic underfunding – advocates and policymakers must rely on independently-produced local studies. Academic researchers (including those referenced in this briefing) have already developed models for these local studies.
In places where there appears to be little or no data published about racial disparities in the pretrial process, advocates can partner with local academic institutions or ask state Statistical Analysis Centers for assistance. Several large-scale projects led by non-governmental organizations are also actively working to assist local jurisdictions in using their data to inform policy changes that will reduce unnecessary incarceration. For example, the MacArthur Foundation’s national Safety and Justice Challenge supports initiatives in 52 jurisdictions across the U.S. to reduce the misuse and overuse of jails. And Arnold Ventures recently launched the National Partnership for Pretrial Justice, advancing a variety of pretrial justice projects across 35 states. Measures for Justice is developing a broad, publicly-accessible database of county criminal justice data; currently it offers data from 6 states, with data from 14 more states expected in 2020. And of course, communitybail funds across the country have been collecting data as they bail low-income defendants out of jail – no strings attached – and reporting high success rates that underscore just how unnecessary money bail is. These kinds of resources can help local advocates and future researchers find the data they need to measure racial disparities in pretrial justice processes, and work to eliminate them.
See the Appendix for a list of all of the sources reviewed for this briefing, with links and summaries of their findings related to racial disparities in pretrial detention.
Footnotes
For more on the negative outcomes related to pretrial detention, see Dobbie, Goldin & Yang (2018) and research from the Pretrial Justice Institute and George Mason University (2016) ↩
Throughout this briefing, I use various terms to refer to different racial and ethnic groups. Where there are inconsistencies, it is because I have attempted to use the same terms as the original source, and these terms vary in the literature. For example, the Bureau of Justice Statistics and the U.S. Census use the term “Hispanic,” and when referencing their data, I use that term instead of the more inclusive “Latinx” that I use elsewhere. I also use the phrase “Black and brown people” to refer Black and any other people of color, rather than using the blanket “people of color” which can unhelpfully obscure the unique experiences of Black people in the U.S., especially in relation to the criminal justice system. ↩
There are several decision points within the pretrial process that are discretionary, and therefore subject to racial bias. The studies I reviewed examined outcomes at several of these stages: (1) the initial release decision; (2) the decision to set financial or non-financial conditions of release; and (3) when financial conditions are set, the bail bond amount. And because racial bias can affect each of these stages, several studies have looked at each stage separately in addition to measuring the cumulative effect of race on the ultimate outcome: whether or not the defendant is detained in jail pretrial. See the Appendix for details. ↩
County and city jails have been called “mass incarceration’s front door,” but campaigns to reform or close jails often don’t receive the attention they deserve. Why? Because the traditional way we measure the impact of jails – the average daily population – significantly understates the number of people directly affected by these local facilities.
Because people typically stay in jail for only a few days, weeks or months, the daily population represents a small fraction of the people who are admitted over the course of a year. But the statistic that better reflects a jail’s impact on a community – the number of people who go to jail – is rarely accessible to the public.
Thankfully, we can now get close to closing this gap in the data and making the impact of jails clearer. Building on our new national report Arrest, Release, Repeat, we’re able to estimate the number of people in every state who go to local jails each year.
To produce these estimates, we analyzed results of the National Survey on Drug Use and Health, an annual survey that primarily concerns health trends but also contains useful data about individuals who have been arrested. The table below shows the results of our state-by-state analysis. For a rich demographic breakdown of people who go to jail (including how many go to jail multiple times a year), see our national report.
Sources and data notes: Estimates of the average daily jail population in every state come from the Bureau of Justice Statistics’ Mortality in Correctional Institutions Statistical Tables (2014). Daily population estimates are not available for six states (Alaska, Connecticut, Delaware, Hawaii, Rhode Island, and Vermont) where the jail system is mostly or entirely integrated into the state prison system. Estimates of how many people in every state go to local jails every year come from our own analysis of the National Survey on Drug Use and Health (NSDUH) 2-Year RDAS (2016-2017). It is important to note that the NSDUH survey methodology excludes several groups, including two groups of people likely to be arrested: people in “group quarters” (like jails, prisons, and hospitals) and people who are homeless and do not use shelters. Because of these exclusions, our estimates of how many people go to jails each year represent a minimum. For a detailed analysis of who goes to jail every year and how many times they go, see our national report Arrest, Release, Repeat. To find out how many people every year are admitted specifically to your county jail, ask your county sheriff.
State
Number of unique annual jail admissions
State population
Unique jail admissions per 100,000 state residents
Average statewide daily jail population
Alabama
90,000
4,867,646
1,849
14,322
Alaska
11,000
740,659
1,485
n/a
Arizona
117,000
6,962,456
1,680
13,961
Arkansas
45,000
2,996,255
1,502
7,945
California
368,000
39,416,565
934
82,440
Colorado
87,000
5,568,630
1,562
12,209
Connecticut
45,000
3,587,935
1,254
n/a
Delaware
18,000
957,319
1,880
n/a
District of Columbia
12,000
689,154
1,741
1,969
Florida
350,000
20,820,495
1,681
54,002
Georgia
236,000
10,371,500
2,275
43,720
Hawaii
15,000
1,428,111
1,050
n/a
Idaho
27,000
1,698,485
1,590
3,685
Illinois
173,000
12,818,875
1,350
22,536
Indiana
122,000
6,650,413
1,834
17,234
Iowa
40,000
3,138,290
1,275
4,326
Kansas
60,000
2,910,427
2,062
7,483
Kentucky
89,000
4,445,151
2,002
22,028
Louisiana
86,000
4,685,245
1,836
31,169
Maine
14,000
1,333,070
1,050
1,820
Maryland
83,000
6,038,465
1,375
11,164
Massachusetts
70,000
6,841,770
1,023
10,228
Michigan
163,000
9,947,878
1,639
16,990
Minnesota
69,000
5,550,828
1,243
6,930
Mississippi
84,000
2,984,758
2,814
13,071
Missouri
128,000
6,102,354
2,098
11,350
Montana
18,000
1,044,575
1,723
2,318
Nebraska
30,000
1,913,840
1,568
3,489
Nevada
38,000
2,968,647
1,280
7,286
New Hampshire
25,000
1,338,905
1,867
2,200
New Jersey
86,000
8,992,030
956
14,997
New Mexico
49,000
2,086,751
2,348
8,278
New York
267,000
19,842,843
1,346
27,453
North Carolina
128,000
10,215,054
1,253
19,412
North Dakota
13,000
755,471
1,721
1,418
Ohio
150,000
11,640,582
1,289
19,112
Oklahoma
96,000
3,926,036
2,445
13,599
Oregon
42,000
4,114,383
1,021
5,985
Pennsylvania
170,000
12,796,311
1,329
37,764
Rhode Island
19,000
1,058,603
1,795
n/a
South Carolina
89,000
4,992,096
1,783
11,501
South Dakota
25,000
865,604
2,888
1,733
Tennessee
117,000
6,682,694
1,751
27,210
Texas
505,000
28,104,729
1,797
66,434
Utah
32,000
3,073,077
1,041
7,352
Vermont
9,000
623,506
1,443
n/a
Virginia
111,000
8,442,200
1,315
30,159
Washington
98,000
7,343,339
1,335
12,311
West Virginia
34,000
1,822,247
1,866
4,292
Wisconsin
129,000
5,784,200
2,230
13,209
Wyoming
8,000
582,113
1,374
1,940
Overall
4,889,000
324,562,557
1,506
750,128
Understanding the true number of people directly affected by local jails allows policymakers to better assess the impact of jail policies. But more importantly, these statistics ought to prompt state and local policymakers to question whether it is necessary to jail so many people in the first place.
As we found in Arrest, Release, Repeat, people who go to county and city jails are disproportionately likely to have a substance use disorder, suffer from a serious mental illness, and lack health insurance. They’re also significantly more likely to be unemployed, have incomes under $10,000, and lack a high school diploma. States and counties should not be using incarceration to address these serious problems of public health and economic inequality.
Moreover, most jail bookings do not improve public safety. Research from the Vera Institute shows that only 5% of arrests every year are for violent offenses, and our analysis in Arrest, Release, Repeat indicates that even the vast majority (88%) of people arrested multiple times per year don’t pose a serious public safety risk.
Needlessly jailing vulnerable people isn’t only a waste of public money: Even short stints in jail can throw an individual’s life into disarray by forcing them to miss work, isolating them from loved ones, and cutting off any medications they are taking. Considering the enormous human costs of excessive incarceration, policymakers should use this new data to assess whether their jails are being used to protect the public or as a temporary – and ineffective – remedy for social problems.
It can be hard to figure out where to start to improve phone justice in each state, especially in the states where legislators, regulators, or individual correctional facilities have already instituted partial reforms. For that reason, we’ve re-organized our national survey of in-state phone rates in to this handy map showing the biggest remaining issues in each state:
No state is perfect on prison and jail telephone issues, and there are many ways to measure “how bad” a state’s prison and jail phone rates are. Some states have good phone rates if they are measured by one criterion, but terrible if measured by a different one. For example, the Minnesota Department of Corrections charges only $0.75 for a 15-minute in-state call from state prison, but the jails in the state charge, on average, $7.19 for the same call. To give a more complete picture of how, exactly, each state is failing, we compiled data on five different measures of prison and jail phone justice (see Table 1 below). For states that rate poorly on multiple measures, the map above offers our opinion about which issue is most important and actionable in that state.
Table 1. How each state fares on five measures of phone justice.
State
State prisons still charge $3.00 or more for a fifteen-minute in-state call (See Table 2)
The average rate charged by jails is $6.00 or more for a fifteen-minute in-state call (See Table 3)
Calls from county jails are far more expensive than calls from the state prison (See Table 4)
At least one jail charges $12.00 or more for a fifteen-minute in-state call (See Table 5)
Jails typically charge far more for the first minute of calls than additional minutes (See Table 6)
Alabama
X
Alaska
X
Arizona
X
Arkansas
X
X
X
California
X
Colorado
X
X
X
Connecticut
X
Delaware
Florida
X
Georgia
Hawaii
Idaho
X
Illinois
X
X
X
X
Indiana
X
X
X
Iowa
X
X
X
Kansas
X
X
X
Kentucky
X
Louisiana
X
Maine
Maryland
X
Massachusetts
X
Michigan
X
X
X
Minnesota
X
X
X
Mississippi
X
Missouri
X
X
X
Montana
X
X
X
Nebraska
X
X
X
Nevada
X
New Hampshire
X
X
New Jersey
New Mexico
New York
X
X
North Carolina
X
North Dakota
X
X
X
Ohio
Oklahoma
X
X
X
Oregon
X
Pennsylvania
X
X
Rhode Island
South Carolina
X
South Dakota
X
X
Tennessee
X
X
Texas
X
X
X
X
Utah
X
X
Vermont
Virginia
X
X
Washington
X
West Virginia
Wisconsin
X
X
Wyoming
X
X
Table 2. Most expensive state prison rates for in-state calls (showing states were the cost is $3 or more)
State
15-Minute Rate from State Prison
Alabama
$3.34
Alaska
$3.15
Arizona
$3.34
Arkansas
$4.80
Connecticut
$3.65
Indiana
$3.60
Kentucky
$3.15
Louisiana
$3.15
Oklahoma
$3.00
Table 3. Average rate charged by jails in each state for in-state calls (showing the most expensive states)
State
Average rate for 15-minute call from jail
Arkansas
$14.19
Colorado
$6.50
Illinois
$7.11
Indiana
$6.31
Iowa
$7.03
Kansas
$8.49
Michigan
$12.03
Minnesota
$7.19
Missouri
$6.90
Montana
$9.24
Nebraska
$8.02
New York
$7.79
North Dakota
$7.62
Oklahoma
$6.34
South Dakota
$7.11
Texas
$6.53
Wisconsin
$7.99
Wyoming
$7.77
Table 4. How much more expensive are jail phone calls in each state compared to prison calls? (Comparing the cost of 15-minute in-state calls and showing states where jail phone calls cost at least 5 times as much as prison calls.)
State
Disparity between average cost of jail call vs. a state prison call
Illinois
52.7
Maryland
5.8
Michigan
5
Minnesota
9.6
Mississippi
9.6
Missouri
9.2
Nebraska
8.5
New Hampshire
23.2
New York
12
North Dakota
6.4
South Carolina
6.9
South Dakota
5.9
Texas
7.3
Virginia
7.4
Table 5. Highest cost for a call in each state (Showing states where at least one jail charges more than $12 for an in-state call)
State
Highest 15-Minute Rate
Arkansas
$24.82
California
$17.80
Colorado
$14.85
Idaho
$17.25
Illinois
$15.52
Indiana
$15.15
Iowa
$14.10
Kansas
$18.62
Michigan
$22.56
Minnesota
$12.02
Missouri
$20.12
Montana
$14.68
Nebraska
$15.80
Nevada
$14.25
North Carolina
$12.00
North Dakota
$12.00
Oklahoma
$18.87
Oregon
$15.75
Pennsylvania
$12.20
Tennessee
$14.29
Texas
$17.25
Utah
$15.06
Virginia
$14.65
Washington
$17.35
Wisconsin
$21.97
Wyoming
$14.22
Table 6. How much more expensive is the first minute of a jail call with subsequent minutes? For example, many jails in New York charge $4.35 for the first minute and $0.40
for subsequent minutes, for a disparity of almost 11 times.) Setting higher first minute rates is a complicated but particularly exploitative practice. (Showing the average disparity between first and subsequent minutes in each state where the first minute cost is at 7 or more times higher than subsequent minutes. States like New York where some or many counties have high first/subsequent minute disparities are not included if the state’s average disparity was less than 7. For county-by-county data, see our 2018 Phones Rate Survey.)
State
Disparity between first minute and subsequent minutes
Colorado
25.04
Florida
7.8
Illinois
8.98
Iowa
9.29
Kansas
25.47
Massachusetts
20.26
Montana
22.84
New Hampshire
9.65
Pennsylvania
7.04
Tennessee
22.49
Texas
15.03
Utah
33.16
For even more detailed data for individual facilities in each state, see these appendix tables from our State of Phone Justice report:
Now that leaders and advocates in each state have easy access to the biggest issues standing in the way of phone justice in their states, it’s time to get moving on making justice a reality.
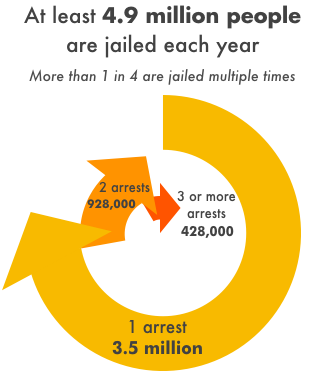
Our analysis reveals that at least 4.9 million people cycle through county jails each year - and most have serious medical and economic needs.
August 26, 2019
Police and jails are supposed to protect the public from serious public safety threats, but what do they actually do? Until now, attempts to answer this question have been missing the most basic data points: how many individuals cycle through local jails every year and who these individuals are.
A new report from the Prison Policy Initiative, Arrest, Release, Repeat, fills this troubling gap in the data. Building on its popular annual snapshot of the U.S. county jail population, the Prison Policy Initiative finds that:
At least 4.9 million people are arrested and booked in jail every year.
At least 1 in 4 people who go to jail in a given year will return to jail over the course of a year.
At least 428,000 people will go to jail three or more times over the course of a year – the first national estimate of a population often referred to as “frequent utilizers.”
“4.9 million people go to jail every year — that’s a higher number than the populations of 24 U.S. states,” said report co-author Alexi Jones. “But what’s even more troubling is that people who are jailed have high rates of economic and health problems, problems that local governments should not be addressing through incarceration.”
The report reveals that:
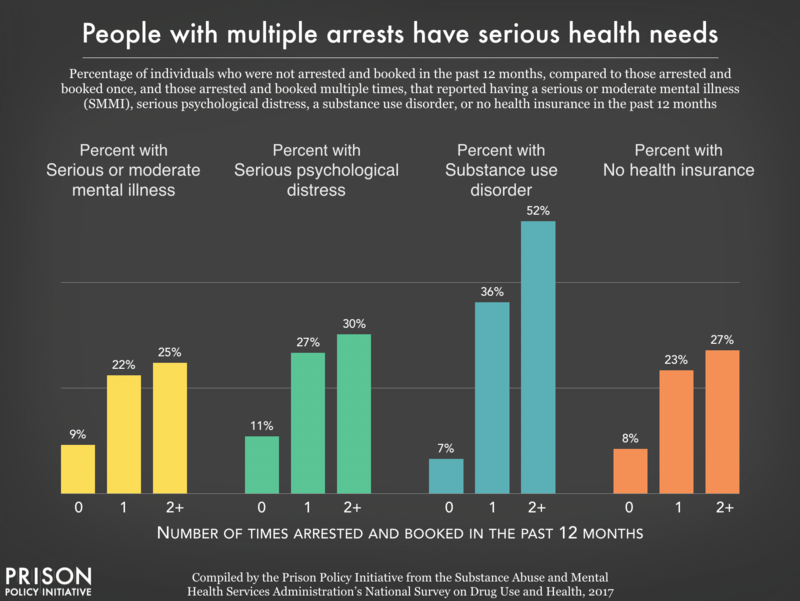
49% of people with multiple arrests in the past year had annual incomes below $10,000, compared to 36% of people arrested only once and 21% of people with no arrests.
Despite making up only 13% of the general population, Black men and women account for 21% of people who were arrested just once and 28% of people arrested multiple times.
People with multiple arrests are much more likely than the general public to suffer from substance use disorders and other illnesses, and much less likely to have access to health care.
The vast majority of people with multiple arrests are jailed for nonviolent offenses such as drug possession, theft or trespassing.
In a series of policy recommendations, the report explains how counties can choose to stop continuously jailing their most vulnerable residents and instead solve the economic and public health problems that often lead to arrest. “Counties should stop using taxpayer dollars to repeatedly jail people,” said report co-author Wendy Sawyer, “and use the savings to fund public services that prevent justice involvement in the first place.”
Journalists, policymakers, and advocates frequently ask us to answer tricky but important questions about the criminal justice system. Until now, however, many of our answers to these common questions have gone unpublished, gathering dust in our email archives. This post is the first in what we anticipate will be an ongoing “Since You Asked” series that makes our answers to these important questions public. (Want to send us your questions? Use our contact page.)
Q:How many people participated in college-in-prison programs before and after the 1994 crime bill? (And how many participate in prison education programming today?)
A: To understand the drop in college participation in prisons following the 1994 “crime bill,” it’s important to know that most in-prison college programs, unlike colleges and universities in the “free world,” largely depend on funding from the Pell Grants program and other federal aid programs. This is largely because incarcerated people are overwhelmingly poor and can neither afford college tuition nor make generous gifts as alumni.
According to a historical overview by the American Enterprise Institute (AEI), prisons “witnessed a surge in demand for college courses” after the passage of the Higher Education Act of 1965, a law that greatly expanded federal aid for college participation nationwide. By 1982, 350 college-in-prison programs enrolled almost 27,000 prisoners (9 percent of the nation’s prison population), primarily through Pell Grants. … By the early 1990s, it is estimated that 772 programs were operating in 1,287 correctional facilities across the nation.”
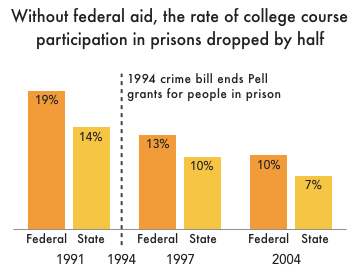
A 1992 amendment to the Higher Education Act made people serving life sentences without parole and those sentenced to death ineligible to receive Pell Grants. Then, the 1994 Violent Crime Control and Law Enforcement Act banned everyone incarcerated in prisons from receiving Pell aid, even though these grants made up less than 1 percent of total Pell spending. “By 1997,” the AEI briefing continues, “it is estimated that only eight college-in-prison programs existed in the United States.” The remaining programs were those that received financial and volunteer support from other sources.
According to the American Historical Association, “States followed by further blocking access to funds through regional programs.” In 2005, the New York Times Magazinewrote that there were “about a dozen” prison college-degree programs, “four of them in New York State.”
The Bureau of Justice Statistics (BJS) 2003 publication Education and Correctional Populations includes some data that reflects these changes (see Table 4). In 1991, 13.9% of people in state prisons, and 18.9% of those in federal prisons, had taken a college course since admission. By 1997, these numbers had dropped to 9.9% for people in state prisons, and 12.9% in federal prisons. The 2004 BJS Survey of Inmates in State and Federal Correctional Facilities (variable V2503) shows that the downward trend continued: In 2004, just 7.3% of respondents in state prisons had taken a college-level class since admission.
More recently, results from a 2014 study of people in prison found that 2% of respondents had completed an Associate’s degree while incarcerated, and 1% had completed a Bachelor’s degree or higher. Notably, 58% of respondents reported that they had not completed any further education while incarcerated.
But these statistics do not reflect a lack of interest in higher education among people in prison: To the contrary, 40% of respondents to the survey said that they would like to enroll in an Associate’s or Bachelor’s degree program, and an additional 29% wanted to enroll in a postsecondary certificate program. Nor are most people in prison unqualified for such programs: A recent report from the Vera Institute of Justice and Georgetown Center on Poverty and Inequality analyzed the same survey results and found that “the majority of incarcerated people are academically eligible for postsecondary-level courses.”
As we’ve previously found, educational exclusion is a strong predictor of incarceration in the U.S. But federal and state governments are far from powerless to repair the harm that results. Restoring Pell Grants to incarcerated people would make approximately 463,000 people in prison eligible for free college courses.
It’s time for the government to not only restore this critical aid, but expand it.
In case you missed it, John Oliver exposed the high fees and low wages pervasive in prisons and jails on last Sunday’s episode of Last Week Tonight.
Oliver cited our research to shine a light on the low wages — or no wages, in the case of Alabama, Arkansas, Georgia and Texas — that incarcerated people receive for their hard work.
Despite the low wages paid to people in prison, Oliver explained, prisons squeeze money out of incarcerated people and their families by forcing them to pay for basic needs, such as:
Hygiene products: Too often, prisons do not provide sufficient hygiene products and incarcerated people are forced to buy additional items on their own dime. We found, for instance, that the average person in an Illinois prison spends $80 a year on toiletries and hygiene products.
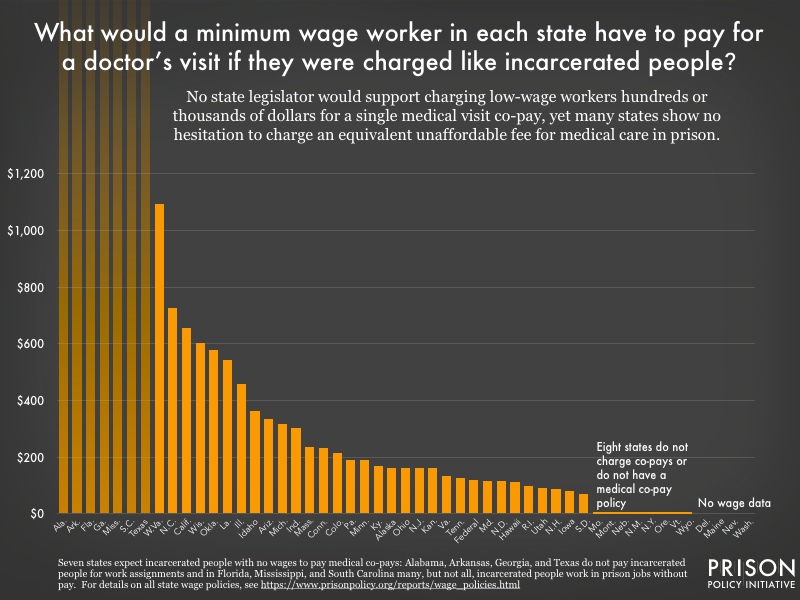
Copays for medical visits: Our 2017 state-by-state analysis revealed that fourteen states charge co-pay amounts equivalent to charging minimum wage workers over $200.
Video calls: Oliver scrutinizes the high cost of video calls and the harmful trend of jails replacing in-person visits with video chats. Oliver states that a video call system is really a “machine that makes money by stopping people from visiting their families,” which is surely “an item at the top of Satan’s Amazon wish list.”
Oliver also shared his skepticism of correctional officials’ claims that banning in-person visits is justified because it reduces contraband. Oliver pointed out that contraband often enters correctional facilities through other channels, such as through staff.
“Part of the way mass incarceration persists in this country is by keeping the true costs of it off the books,” Oliver concludes. We couldn’t agree more. Thank you, Last Week Tonight, for helping us expose these harmful practices!
Prison healthcare is almost always a depressing topic, but not today, when we can report an important victory: Illinois recently became the third state in 2019 to reform the practice of charging medical co-pays to incarcerated people.
Previously, we published a state-by-state analysis showing that most prisons charge medical copays to people inside – despite the fact that their patients are impoverished and earn little to no money for their work in prisons. Using prison and free-world wage data, we calculated what each state’s co-pay would cost if it was charged to free-world patients making the minimum wage. Our analysis revealed that fourteen states charge co-pay amounts equivalent to charging minimum wage workers over $200.
Charging co-pays to incarcerated people to shore up a state’s correctional budget is simply wrong. In our analysis, we explained that not only does this policy squeeze poor people and their families; it hurts public health by making the choice to seek medical attention a costly one.
We’re glad to see that states are now paying attention and taking action:
Illinois Governor J.B. Pritzker signed a bill in July eliminating the state’s $5 co-pay. Previously, people working in an Illinois state prison (where the minimum wage is 9 cents per hour) would have had to work for over 55 hours to afford the $5 fee. That’s like charging a non-incarcerated minimum-wage earner in Illinois over $460. In some cases, incarcerated people paid even more before getting adequate care, because paying the fee didn’t guarantee a doctor visit – only that a nurse would review one’s medical request.
Earlier this year, the California Department of Corrections and Rehabilitation announced that it would stop charging a $5 medical co-pay to incarcerated people. CDCR’s press release acknowledged what advocates have long known: Charging co-pays is bad for public health. “Copayments,” it said, “may hinder patients from seeking care for issues which, without early detection and intervention, may become exacerbated.” The department’s decision came as the California legislature was considering AB 45, a bill to eliminate medical co-pays in both state prisons and county jails. AB 45 (for which we wrote a letter of support) continues to move through the state legislature.
The Texas legislature stopped short of eliminating medical co-pays in prisons entirely, but made progress by replacing the notorious $100 fee Texas had charged incarcerated people with a $13.55 per-visit fee. While this change marks a substantial improvement, incarcerated people in Texas – who earn nothing for their labor – will continue to be charged the highest medical co-pay in state prisons nationwide.
State reforms like these can’t come soon enough. As we noted in our 2017 analysis, out-of-reach co-pays in prisons and jails have two inevitable and dangerous consequences. First, when sick people avoid the doctor, disease is more likely to spread to others in the facility – and into the community, when people are released before being treated. Second, illnesses are likely to worsen as long as people avoid the doctor, which means more aggressive (and expensive) treatment when they can no longer go without it.
It’s welcome news that states are finally taking action to change this risky and regressive policy. Will your state be next?
Women make up a growing share of incarcerated populations, and they have different needs than justice-involved men. Accordingly, some prison systems have begun to implement gender-responsive policies and programs. But what happens after release?
Given the dramatic growth of women’s incarceration in recent years, it’s concerning how little attention and how few resources have been directed to meeting the reentry needs of justice-involved women. After all, we know that women have different pathways to incarceration than men, and distinct needs, including the treatment of past trauma and substance use disorders, and more broadly, escaping poverty and meeting the needs of their children and families. In recognition of these differences, and in an effort to reduce the harms of incarceration and the likelihood of re-incarceration, many prison systems have begun to implement gender-responsive policies and programs. But what’s being done to help women get the support they need to rebuild their lives after release?
A handful of programs have sprung up in communities around the country to meet the needs of women returning home: some founded by formerly incarcerated women themselves, some running on shoestring budgets for years, and all underscoring the need for greater capacity to meet the demand of over 81,000 releases from prison and 1.8 million releases from jail each year.
Women make up 1 in 8 individuals released from state prisons each year, but the numbers vary widely between states. The additional 1.8 million women released from local jails annually are not shown on this map, because not all states have data available for jail releases, and in most states, a significant portion of reported releases are missing data on sex. See the table below for the available jail data.
Annual releases of women from state prisons and local jails
*Note: The numbers in this table represent the minimum number and percentages of jail releases that are women. The actual numbers are probably greater, because a significant number of releases reported in the Census of Jails, 2013 are missing data on sex. (Nationally, 15% of all release records were missing this data.) The percentages of releases that are women, as reported in this table, were calculated based on the total number of jail releases, including those with no data on sex.
Sources and data notes: For prison releases, data are from the Bureau of Justice Statistics National Corrections Reporting Program, except for Vermont, which did not report release data by sex to NCRP. Vermont’s prison release data comes from BJS’ CSAT-Prisoners tool, and only includes releases of individuals sentenced to more than 1 year. Prison release data are from 2016 for all states except New Mexico (2015), North Dakota (2015), and Oregon (2013). Jail data are from the BJS Census of Jails, 2013, and are not available for 5 states (Connecticut, Delaware, Hawaii, Rhode Island, and Vermont) where the jail system is entirely integrated into the state prison system. In Alaska, there are a small number of locally operated jails not part of the state system, so available data reflect only the locally operated jails and not the entire jail population.
Prisons
Jails
Prisons & Jails combined
State
Women released
Percentage of all prison releases
Women released*
Percentage of all jail releases*
Women released*
Percentage of all releases*
Alabama
2,013
14%
39,740
18%
41,753
18%
Alaska
2,181
22%
510
14%
2,691
20%
Arizona
2,707
14%
46,162
23%
48,869
22%
Arkansas
4,456
15%
27,322
14%
31,778
15%
California
2,495
7%
186,571
20%
189,066
20%
Colorado
1,178
13%
44,204
24%
45,382
23%
Connecticut
1,281
13%
n/a
n/a
n/a
n/a
Delaware
1,749
19%
n/a
n/a
n/a
n/a
Florida
3,670
12%
121,336
19%
125,006
18%
Georgia
1,931
11%
84,398
18%
86,329
18%
Hawaii
141
14%
n/a
n/a
n/a
n/a
Idaho
931
21%
11,323
22%
12,254
22%
Illinois
2,190
8%
33,875
12%
36,065
11%
Indiana
2,087
14%
27,520
11%
29,607
11%
Iowa
865
16%
25,998
22%
26,863
22%
Kansas
1,012
16%
24,640
17%
25,652
17%
Kentucky
3,563
21%
104,403
23%
107,966
23%
Louisiana
1,853
11%
45,935
16%
47,788
16%
Maine
159
13%
5,422
27%
5,581
26%
Maryland
756
8%
27,711
17%
28,467
17%
Massachusetts
738
26%
4,323
6%
5,061
7%
Michigan
959
9%
51,240
17%
52,199
17%
Minnesota
898
11%
36,230
20%
37,128
20%
Mississippi
965
12%
17,207
17%
18,172
17%
Missouri
3,454
18%
36,395
16%
39,849
16%
Montana
154
13%
7,755
20%
7,909
20%
Nebraska
321
14%
16,902
24%
17,223
24%
Nevada
816
14%
34,374
23%
35,190
23%
New Hampshire
240
15%
5,732
26%
5,972
25%
New Jersey
563
6%
18,037
13%
18,600
13%
New Mexico
502
14%
20,171
21%
20,673
20%
New York
1,551
7%
28,241
15%
29,792
14%
North Carolina
2,411
12%
65,085
16%
67,496
15%
North Dakota
306
20%
3,857
13%
4,163
13%
Ohio
3,521
14%
79,848
20%
83,369
20%
Oklahoma
1,724
16%
23,453
14%
25,177
14%
Oregon
639
12%
38,292
22%
38,931
22%
Pennsylvania
2,374
9%
34,698
18%
37,072
17%
Rhode Island
326
10%
n/a
n/a
n/a
n/a
South Carolina
1,065
12%
45,045
14%
46,110
14%
South Dakota
447
18%
14,011
25%
14,458
24%
Tennessee
2,478
17%
94,544
24%
97,022
24%
Texas
12,453
16%
145,430
14%
157,883
14%
Utah
540
15%
14,165
16%
14,705
16%
Vermont
280
16%
n/a
n/a
n/a
n/a
Virginia
1,771
14%
51,266
18%
53,037
18%
Washington
948
12%
62,503
23%
63,451
23%
West Virginia
583
17%
11,201
24%
11,784
24%
Wisconsin
835
9%
34,906
18%
35,741
17%
Wyoming
149
14%
2,580
8%
2,729
9%
National
81,229
13%
1,854,561
18%
1,935,790
18%
In 2016, about 81,000 women were released from state prisons nationwide, and women and girls accounted for at least 1.8 million releases from local jails in 2013 (the last year all jails were surveyed). While many people are released from jail within a day or so and may not need reentry support, jail releases can’t be overlooked, especially for women, who are more likely than men to be incarcerated in jails as opposed to prisons. (Moreover, jails typically provide fewer programs and services than prisons, so individuals released from jails are even less likely to have received necessary treatment or services while incarcerated than those in prison.)
Those figures mean that nationally, about 1 in 8 (13%) of all individuals released from state prisons – and more than 1 in 6 (18%) jail releases – are women. In 20 states, at least 1 in 5 (20%) individuals released from any incarceration (either prison or jail) is female. Fully half of all states release at least 1,000 women from prison annually; in Texas, it’s over 12,000 women per year.
As in other stages of the criminal justice system, most post-release policies and programs were created with the much larger male population in mind. But research makes clear that women returning home have “a significantly higher need for services than men,” and that reentry supports should be responsive to the particular needs of justice-involved women:
Economic marginalization and poverty: As we’ve previously shown, formerly incarcerated women (especially women of color) have much higher rates of unemployment and homelessness, and are less likely to have a high school education, compared to formerly incarcerated men. These findings help explain why, in a 2012 National Institute of Justice (NIJ) study, 79% of women interviewed 30 days pre-release cited “employment, education, and life skills services” as their greatest area of need (followed closely by transition services). An earlier study (Holtfreder et al., 2004), found that poverty is the strongest predictor of recidivism among women, and “providing state‐sponsored support to address short‐term needs (e.g., housing) reduces the odds of recidivism by 83%” for poor women on probation and parole.
Housing: A 2017 Prisoner Reentry Institute (PRI) report identified homelessness and the lack of stable housing as the biggest problem facing women in the New York City justice system, noting that 80% of women at Rikers said they needed assistance finding housing upon discharge. A 2006 California study found that 75% of formerly incarcerated women surveyed had experienced homelessness as some point, and 41% were currently homeless. Women who can’t secure safe housing may return to abusive partners or family situations for housing and financial reasons – a point echoed in interviews with paroled women in a study by Brown and Bloom.
Trauma and gendered pathways to incarceration: The PRI report emphasizes the importance of gender-responsive and trauma-informed interventions for reducing recidivism among women. According to that report, such interventions should: provide a safe, respectful environment; promote healthy relationships; address substance use, trauma, and mental health issues; provide women with opportunities to improve their socioeconomic conditions; establish “comprehensive and collaborative” community services; and prioritize women’s empowerment.
Family reunification: Most incarcerated women are mothers, and are frequently the primary caretakers of their children. The importance of family reunification – noted throughout the literature, by Carter et al. (2006), Brown and Bloom (2009), Wright, et al. (2012), the NIJ (2012), among others – cannot be overstated, especially given the trauma experienced by children when separated from a parent.
While the complexity of women’s reentry needs can be daunting, there are successful models in operation demonstrating how states, counties, and communities can best serve them. Notably, A New Way of Life Reentry Project operates eight houses in Los Angeles and is working toward expanding its model nationally. The program offers wraparound services including transitional housing, case management, and legal services to support women as they navigate reentry. Staff support women from initial reentry tasks like obtaining ID cards and applying for public assistance all the way through the process of regaining custody of children and finding permanent housing. Similar programs offering wraparound services exist in other cities, such as the Ladies of Hope Ministry’s Hope House in New York City; the Center for Women in Transition in St. Louis; and Angela House in Houston, which also provides programming tailored “to the health and psychosocial needs of women recovering from sexual exploitation.”
Frustratingly, despite their success, these programs lack the funding and capacity to serve all of the women who desperately need them: Angela House notes on its website that it can only serve 12 to 14 women at a time, but receives more than 300 applications every year. Unless state governments and federal agencies take action to grow the capacity of these service providers, hundreds of thousands of women every year will leave prison or jail without the resources they need to succeed. As lawmakers increasingly call for policy changes to help women in prison, they must not ignore the massive gap between the need and availability of women’s reentry programs.
A detailed spreadsheet including release data for both men and women is available on our Data Toolbox page.
"Women’s experiences with the criminal justice system serve to highlight the faults of the whole system," our Legal Director explained to members of the House Judiciary Committee.
Yesterday, our Legal Director, Aleks Kajstura, spoke to members of the House Judiciary Committee at a hearing about the mass incarceration of women and girls. “Today’s hearing begins a discussion about women in the criminal justice system,” said subcommittee chair Rep. Karen Bass (D-CA). “After decades of policies that led to mass incarceration, we are finally at a point of examining the policies and the consequences.”
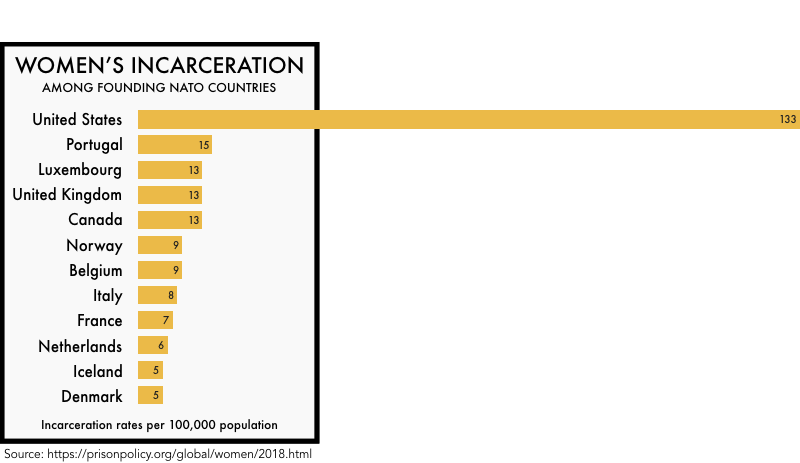
Testifying alongside Piper Kerman, Jesselyn McCurdy, Cynthia Shank and Patrice Onwuka, Kajstura spoke about the urgency of reducing women’s incarceration. She highlighted a few of the most alarming data points from our research on women and gender, including:
The U.S. is home to only 5% of the world’s female population, but accounts for nearly 30% of the world’s incarcerated women.
In a number of states, women’s prison populations are growing faster than men’s; in others, women’s prison populations are growing even as men’s are declining.
3 out of 4 women under correctional control are on probation, a system that sets up women – and particularly mothers – to fail.
Despite this unacceptable status quo, the hearing sent a hopeful message: Lawmakers across the aisle are finally paying attention to women’s mass incarceration. “It is critical that we understand how and why women become involved in the system, what happens to them when they are incarcerated, and what their trajectory is once released,” said Bass.
Air conditioning has become nearly universal across the South over the last 30 years, with one exception: in prisons. Although 95% of households in the South use air conditioning, including 90% of households that make below $20,000 per year,1 states around the South have refused to install air conditioning in their prisons, creating unbearable and dangerous conditions for incarcerated people.
13 famously hot states lack universal A/C in their prisons
While there are no national statistics on air conditioning in prison, we found that at least 13 states in the hottest regions of the country lack universal air conditioning in their prisons:
Alabama
Arizona
Florida
Georgia
Kansas
Kentucky
Louisiana
Mississippi
Missouri
North Carolina
South Carolina
Texas
Virginia
For more information on these states, see the appendix.
The lack of air conditioning in Southern prisons creates unsafe—even lethal—conditions. Prolonged exposure to extreme heat can cause dehydration and heat stroke, both of which can be fatal. It can also affect people’s kidneys, liver, heart, brain, and lungs, which can lead to renal failure, heart attack, and stroke.
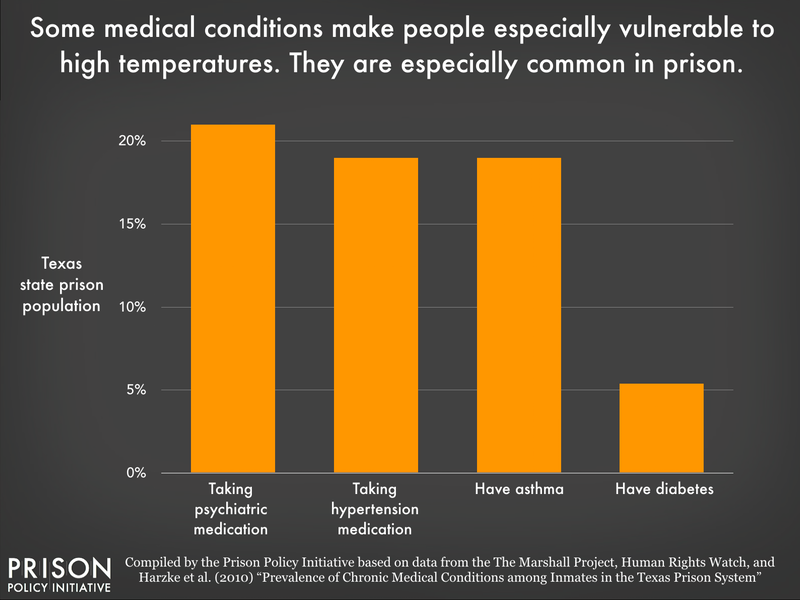
Many people in prison are especially susceptible to heat-related illness, as they have certain health conditions or medications that make them especially vulnerable to the heat. Conditions such as diabetes and obesity can limit people’s ability to regulate their body heat, as can high blood pressure medications and most psychotropic medications (including Zoloft, Lexapro, Prozac, Cymbalta, and more but excluding the benzodiazepines). Old age also increases risk of heat-related illness, and respiratory and cardiovascular illnesses, such as asthma, are exacerbated by heat.
In Texas, a state that has air conditioning in all inmate housing areas in only 30 of its 109 prisons, a high percentage of incarcerated people are particularly vulnerable to heat:
The structure of prisons and prison life can also make incarcerated people more vulnerable to heat. Prisons are mostly built from heat-retaining materials which can increase internal prison temperatures. Because of this, the temperatures inside prisons can often exceed outdoor temperatures. Moreover, people in prison do not have the same cooling options that people on the outside do. As Prison Legal Newsexplains in a 2018 article on prison air conditioning litigation, “people outside of prison who experience extreme heat have options that prisoners often lack – they can take a cool shower, drink cold water, move into the shade or go to a place that is air conditioned. For prisoners, those options are generally unavailable.” Even fans can even be inaccessible. For example, despite the fact that incarcerated people in Texas are not paid for their labor, purchasing a fan from the Texas prison commissary costs an unaffordable $20.
The lack of air conditioning in prisons has already had fatal consequences. In 2011, an exceptionally hot summer in Texas, 10 incarcerated people died from heat-related illnesses during a month-long heat wave. (It’s just not incarcerated people who get sick from the heat in the state’s prisons. In August 2018, 19 prison staff and incarcerated people had to be treated for heat-related illnesses.) As David Fathi, director of the American Civil Liberties Union National Prison Project, explained to The Intercept, “Everyone understands that if you leave a child in a car on a hot day, there’s a serious risk this child could be injured or die. And that’s exactly what we’re doing when we leave prisoners locked in cells when the heat and humidity climb beyond a certain level.”
Courts in Wisconsin, Arizona, and Mississippi have ruled that incarceration in extremely hot or cold temperatures violates the Eighth Amendment. But these court cases have not had a national impact on air conditioning in prisons. As Alice Speri of The Interceptexplains, “There’s no national standard for temperatures in prisons and jails, and as jurisdiction over prisons is decentralized among states and the federal system, and jurisdiction over jails is even more fragmented among thousands of local authorities across the country, fights over excessive heat in detention can only be waged facility by facility.” As a result, incarcerated people in the South are subjected to unbearable conditions that violate their basic human and constitutional rights. Benny Hernandez, an incarcerated man in Texas, describes how torturous heat gets in prisons: “It routinely feels as if one’s sitting in a convection oven being slowly cooked alive. There is no respite from the agony that the heat in Texas prisons inflicts.”
Refusing to install air conditioning is a matter not just of short-term cost savings, but of appearing tough on crime. State and local governments go to astonishing lengths to avoid installing air conditioning in prisons. In 2016, Louisiana spent over $1 million in legal bills in an attempt to avoid installing air conditioning on death row, an amount four times higher than the actual cost of installing air conditioning, according to an expert witness. Similarly, in 2014, the people of Jefferson Parish, LA only voted to build a new jail after local leaders promised there would be no air conditioning.
With air conditioning nearly universal in the South, air conditioning should not be considered a privilege or amenity, but rather a human right. States and counties that deny air conditioning to incarcerated people should understand that, far from withholding a “luxury,” they are subjecting people to cruel and unusual punishments, and even handing out death sentences.
Footnotes
The U.S. Energy Information Administration’s 2015 Residential Energy Consumption Survey has data on air conditioning use by income and geographical region. This Agency uses the Census Bureau’s definition of the South: Delaware, Maryland, Virginia, West Virginia, Kentucky, North Carolina, South Carolina, Tennessee, Georgia, Florida, Alabama, Mississippi, Arkansas, Louisiana, Texas, and Oklahoma plus Washington D.C. Nationwide, air conditioning usage is slightly lower than in just the South, with 87% of households (and 80% of people making below $20,000 per year) using air conditioning nationwide. . ↩
Appendix
Examining local and national news stories, we identified 12 states in the South and Midwest that lack universal air conditioning and identified only Arkansas as having universal air conditioning.
State
Air Conditioning?
Alabama
Prisons in Alabama do not have air conditioning. (Source)
Arizona
Many prisons in Arizona lack air conditioning. (Source)
Arkansas
Prisons have had air conditioning since the 1970s. (Source)
Florida
State run prisons do not have air conditioning, but private prisons in the state do have air conditioning. (Source)
Georgia
Most prisons have air conditioning, but some do not. (Source)
Kansas
Most prisons do not have air conditioning. 70 percent of incarcerated people are in buildings without air conditioning. (Source)
Kentucky
Most prisons do not have air conditioning. (Source)
Louisiana
Most prisons do not have air conditioning. (Source)
Mississippi
Most inmate housing in Mississippi has no air conditioning. (Source)
Missouri
Some prisons lack universal air conditioning. (Source)
North Carolina
Most prisons have air conditioning, but 10 facilities do not. (Source)
South Carolina
Most prisons have air conditioning, but some facilities do not. (Source)
Texas
30 of the 109 state prisons in Texas have air conditioning in all housing areas. (This is despite the fact county jails in the state are statutorily required keep their temperatures between 65 and 85 degrees). (Source)
Virginia
Half of prisons have no air conditioning. (Source)
March 19, 2025: Join Prison Policy Initiative’s Advocacy Department at 1 PM EST on Wednesday, March 19, 2025, for a webinar about understanding recidivism. We will cover strategies from our recidivism toolkit, including an overview of recidivism statistics and what they really mean, how to combat the “Willie Horton” effect, and ways that advocates can transform the narrative around reentry to make it less focused on negative outcomes and more focused on the ways that returning citizens contribute to their communities.
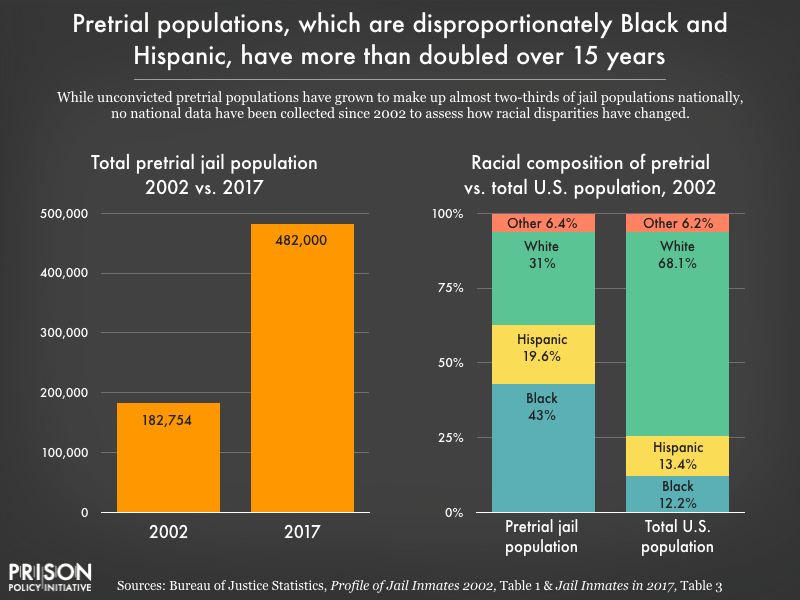 While pretrial jail populations have grown to make up almost two-thirds of jail populations nationally, and Black and Hispanic defendants were overrepresented in the 2002 population, no national data have been collected since then to assess how racial disparities may have changed.
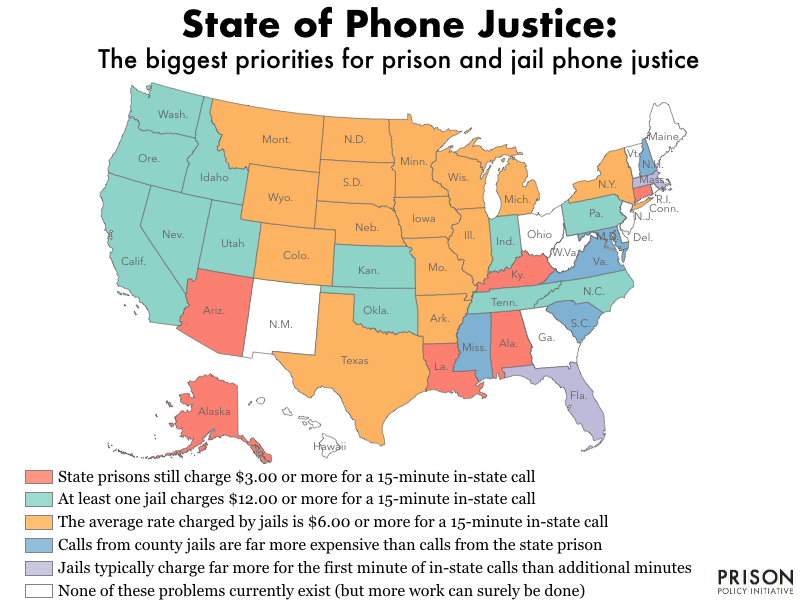
 Policy details and sourcing information can be found in the