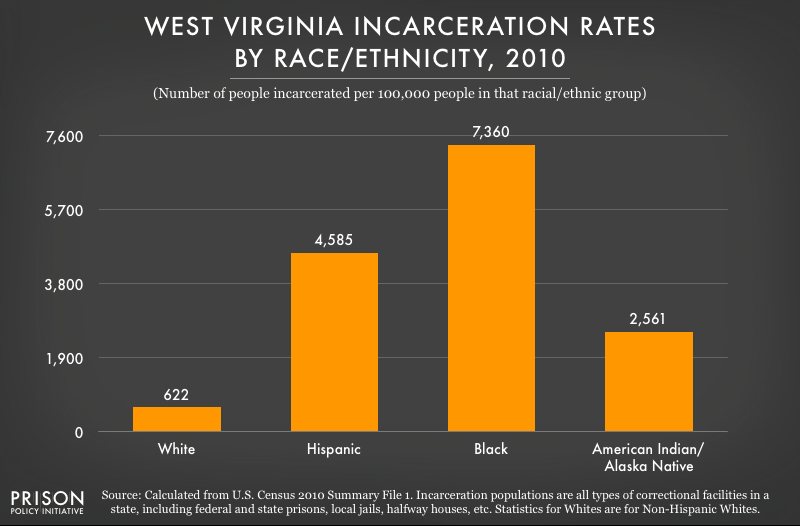
Data Source: U.S. Census 2010, Summary File 1. (Graph: Leah Sakala, May 2014)
This graph uses U.S. Census data for all people incarcerated in the state, including people in federal and state prisons, local jails, halfway houses, etc. While state and local facilities contain people processed by the West Virginia judicial systems, the federal prisons contain people sent to those facilities by courts all over the country.
For our purposes, the fact that federal prison populations are included in the Census Bureau's data as residents of West Virginia would be an unimportant statistical quirk except for that fact that there are so many federal prisons in West Virginia. In fact, slightly more than half of the incarcerated people that the Census counted in West Virginia were in a federal prison. This has a dramatic impact of the demographics of the incarcerated population. If the Census Bureau's federal prison counts were removed from this analysis, the incarceration rates would be 396 for Whites, 370 for Hispanics, 1911 for Blacks, and 726 for American Indian and Alaska Natives.
 This graph is a part of Breaking Down Mass Incarceration in the 2010 Census: State-by-State Incarceration Rates by Race/Ethnicity, a Prison Policy Initiative briefing.


Events
- April 15-17, 2025:
Sarah Staudt, our Director of Policy and Advocacy, will be attending the MacArthur Safety and Justice Challenge Network Meeting from April 15-17 in Chicago. Drop her a line if you’d like to meet up!
Not near you?
Invite us to your city, college or organization.