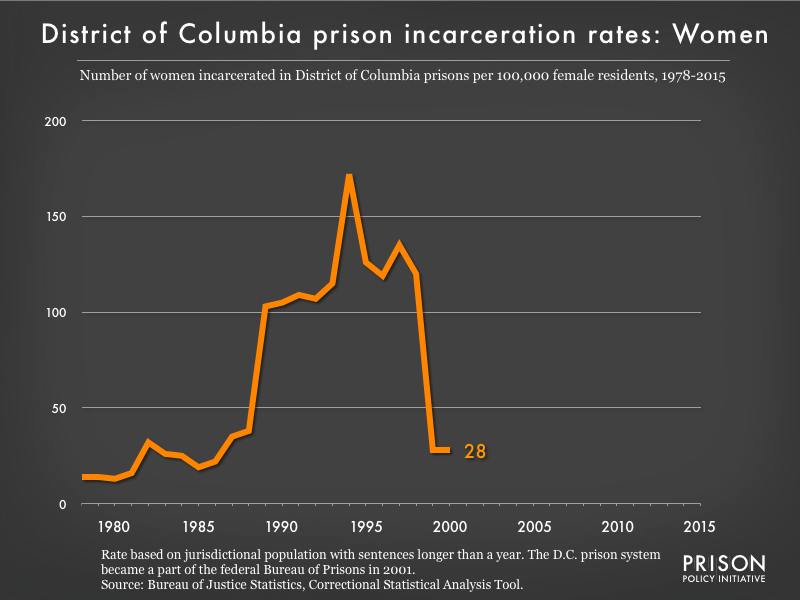
(Graph: Wendy Sawyer, January 2018)
 This graph is a part of the Prison Policy Initiative report, The Gender Divide: Tracking women's state prison growth.
Recommended Reading:

50 state incarceration profiles
All of our recent reports about prison/jail growth, racial disparities, and more, re-organized by state.

The rapid & unregulated growth of e-messaging in prisons
It can strengthen connections, but instead has been used to sap money from incarcerated people.

Incarceration and supervision by states
Probation and parole are the leading forms of mass punishment in America.

Prison Gerrymandering Project
We are leading the movement to protect our democracy from the Census Bureau's prison miscount.
Events
- April 15-17, 2025:
Sarah Staudt, our Director of Policy and Advocacy, will be attending the MacArthur Safety and Justice Challenge Network Meeting from April 15-17 in Chicago. Drop her a line if you’d like to meet up!
Not near you?
Invite us to your city, college or organization.