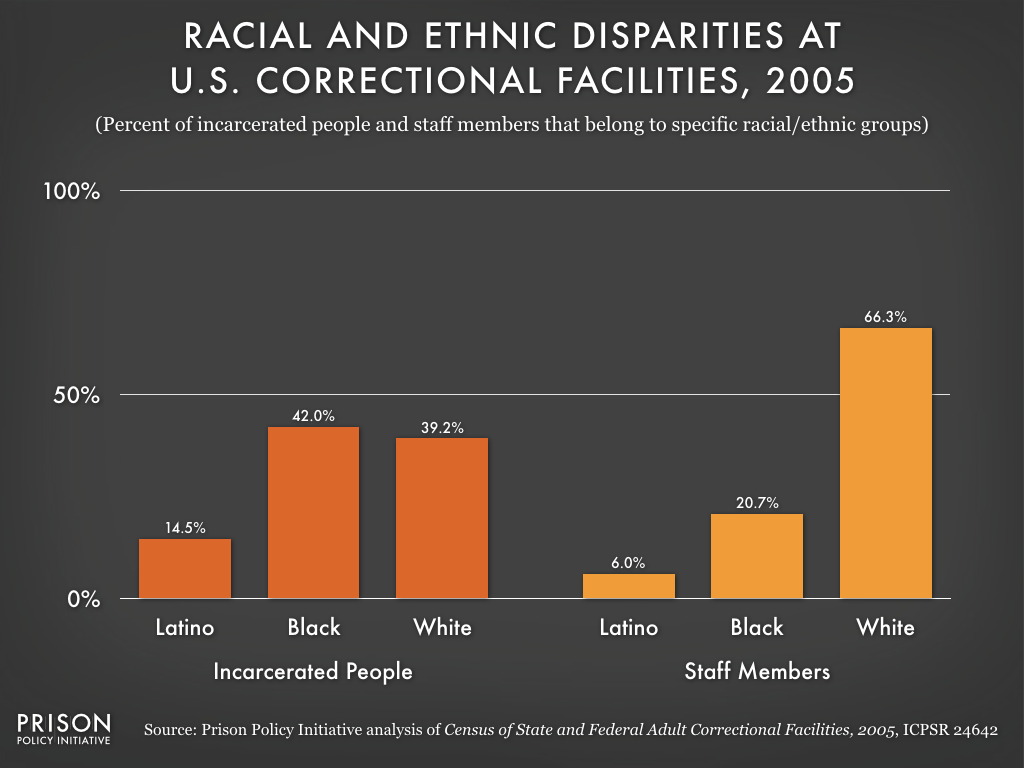
Data Source: Prison Policy Initiative analysis of Census of State and Federal Adult Correctional Facilities, 2005, ICPSR 24642. (Graph: Rachel Gandy, 2015)
This graph originally appeared in In prisons, Blacks and Latinos do the time while Whites get the jobs.
This graph shows that the patterns of racial and ethnic disparity exist across the United States. In 2005, over half of the nation's incarcerated people were Black or Latino, but only a quarter of correctional staff members were Black or Latino.
Events
- April 15-17, 2025:
Sarah Staudt, our Director of Policy and Advocacy, will be attending the MacArthur Safety and Justice Challenge Network Meeting from April 15-17 in Chicago. Drop her a line if you’d like to meet up!
Not near you?
Invite us to your city, college or organization.


