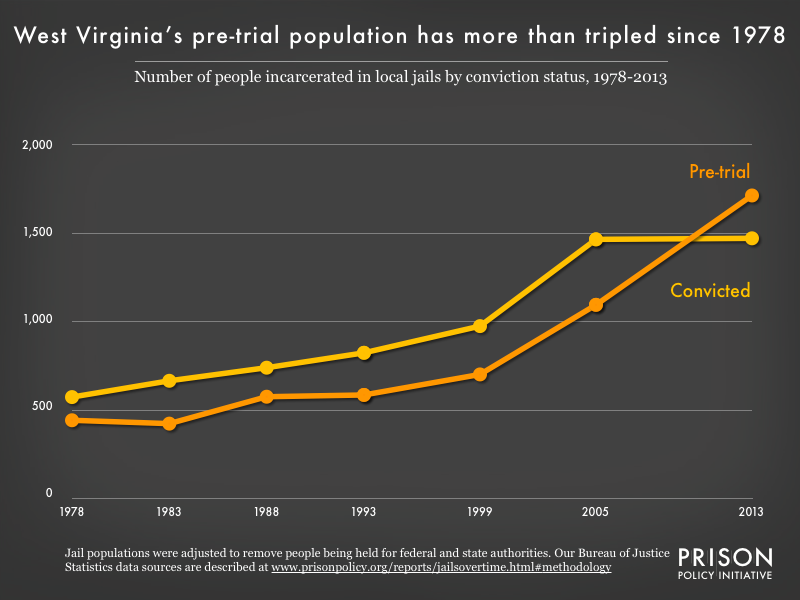
(Graph: Joshua Aiken, May 2017)
This graph excludes people held for state or federal authorities from the total count of people held in West Virginia jails. Because a significant proportion (31%) of the population in West Virginia’s jails is held for the state prison system and the U.S. Marshals Service, this graph likely overstates the convicted population and understates the pre-trial population. (See our methodology.)
 This graph is a part of the Prison Policy Initiative report, Era of Mass Expansion: Why State Officials Should Fight Jail Growth.
Events
- April 15-17, 2025:
Sarah Staudt, our Director of Policy and Advocacy, will be attending the MacArthur Safety and Justice Challenge Network Meeting from April 15-17 in Chicago. Drop her a line if you’d like to meet up!
Not near you?
Invite us to your city, college or organization.


