This report has been updated with a new version in 2024.
- Table of Contents
- Introduction
- Jail growth is not inevitable
- Pre-trial policies have a warehouse effect
- Renting jail space: a perverse incentive that fuels jail overgrowth
- Recommendations
- And more:
- State graphs
- Methodology
- Appendices
- About the Prison Policy Initiative
- About the author
- Acknowledgements
Era of Mass Expansion:
Why State Officials Should Fight Jail Growth
a Prison Policy Initiative Report
by Joshua Aiken
Press Release
May 31, 2017
One out of every three people behind bars is being held in a local jail, yet jails get almost none of the attention that prisons do. Jails are ostensibly locally controlled, but the people held there are generally accused of violating state law, and all too often state policymakers (and state reform advocates) ignore jails. In terms of raw numbers state prison reform is the larger prize, but embracing the myth that jails are only a local matter undermines current and future state-level reforms. Jails may be locally controlled, but jail practices reflect state priorities and change state-wide outcomes.
The 11 million1 people who go to jail each year are there generally for brief, but life-altering2, periods of time. Most are released in days or hours after their arrest, but others are held for months or more3, often because they are too poor to make bail. Only about a third of the 720,000 people in jails on a given day have been convicted4 and are serving short sentences, typically under a year and most often for misdemeanors. Jail policy is therefore in large part about how people — who are legally innocent, until proven guilty — are treated and about how policymakers think our criminal justice system should respond to low-level offenses. As this report will explain, jails impact our entire criminal justice system and millions of lives every year.
Since the 1980s, the U.S. jail population has more than tripled.5 While “tough on crime” attitudes have resulted in increasing numbers of people convicted of minor crimes, this brief focuses on the two real drivers of jail growth:
- a massive increase in the number of people held before trial (the “pre-trial” population)
- an increasing number of jails that run a side-business of renting jail cells to other authorities
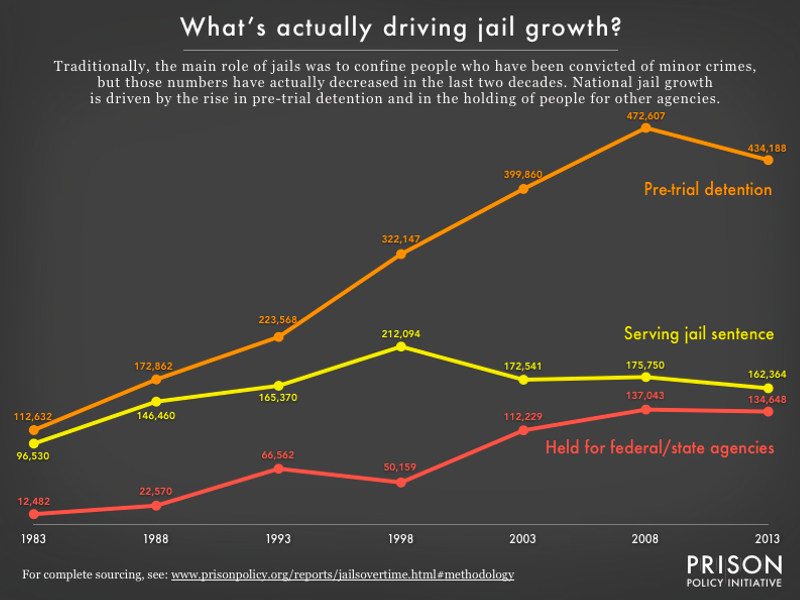 Figure 1. Most state policymakers are not tracking jails in the first place, and the jails’ frequent practice of renting cells to other agencies makes it difficult to draw conclusions from the little data that is available. This report offers a new analysis of federal data to offer a state-by-state view of how jails are being used and we find that, even more than previous research has implied, pre-trial populations are driving “traditional jail” growth. The data behind this graph is in Table 1.
If lawmakers want criminal justice reform, they’ll have to pay attention to jails. To help state officials and state-level advocates craft reform strategies appropriate for their unique situations, this report uses obscure federal government data to offer state-specific graphs on conviction status, prison growth, and jail growth in each state.
It is our hope that this report will prompt detailed examinations of policy and practice in each state: bail policies, citation and arrest practices, overzealous prosecutors, over-burdened courts, harsh criminalization laws, rare or underfunded pre-trial services and diversion programs, and a number of other factors that send jail incarceration rates off the charts. Lawmakers need to know that in most states, their jail incarceration rate is higher than the combined prison and jail incarceration rate in countries like Australia, France, Libya, and Uganda.6
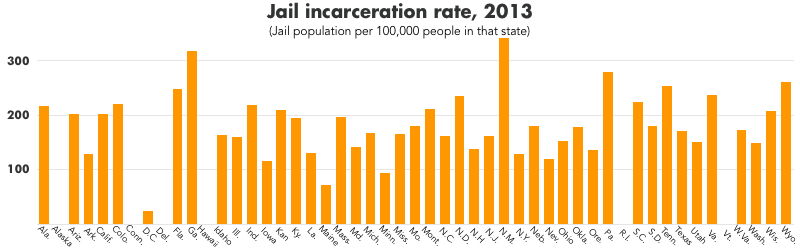 Figure 2. To allow meaningful comparisons between states of how frequently local officials use jails to incarcerate people pre-trial or for minor (typically misdemeanor) offenses, this chart shows the jail population in each state per 100,000 people in that state. This chart does not include any people physically present in jails who are held for federal or state agencies. As described below, confining people for other agencies has serious policy implications, but is separate from the valuable discussion of how states differ in their approach to detention and incarceration of people either awaiting trial or convicted of minor offenses. The data behind this graph is in Table 2.
Jail growth is not inevitable
The growth of jails is, in the arc of history, a modern phenomenon that occurred with little state oversight.7 While jail policies directly influence the state prison population, most governors may be unaware of the pace of jail expansion in their state because jail construction was largely financed by local — not state — taxpayers.
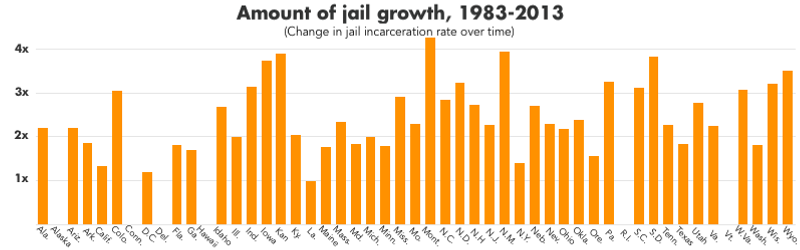 Figure 3. In most states over the last three decades, the number of people in jails has outpaced population growth by 2, 3 or even 4 times. In 32 states, the jail incarceration rate has doubled since 1983, and in 12 states, the jail population has grown more than 3 times faster than the general population. (This chart does not include any people physically present in jails who are held for federal or state agencies. In all but one state (Louisiana), even this adjusted jail population is growing faster than the general population.) The data behind this graph is in Table 2.
The key driver of jail growth is not courtroom judges finding more people guilty and sentencing them to jail. The convicted population has actually decreased in the last 20 years.
 Jail growth has occurred predominately — and in the last 15 years, almost entirely8— in the number of people being detained pre-trial. This is a population that is considered innocent under the law, for whom detention was historically restricted to those who posed a genuine risk of flight or whose freedom was an actual threat to public safety. Many things have changed over the last three decades. Changes to police strategy mean that interactions with the police are more likely to result in arrest9, and the increased reliance on money bail10 means that the courts have imposed a wealth-based test on freedom.
Pre-trial policies have a warehouse effect
Looking at jail policy at the state level is especially important because, while local officials are the primary decision-makers, state lawmakers set the rules by which those decisions are made. The charging practices of county prosecutors and the bail decisions of local judges can be impacted by whether or not a state collects data on prosecutorial discretion or regulates the bail industry. The inaction of state lawmakers has allowed certain local officials to churn millions of people through the entire criminal justice system. As a result, today, local jails are filled with people who are legally innocent, marginalized, and overwhelmingly poor.
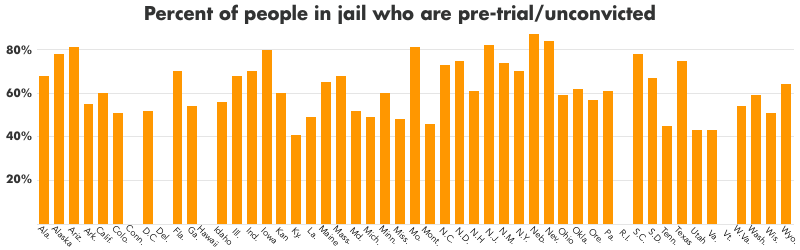 Figure 4. In the eight states where convicted people make up the majority of the jail population, that status is less likely to be the result of particularly enlightened bail policies, and more likely to be the result of the jails in that state renting large numbers of cells to the state prison system. As discussed below, the practice of renting large numbers of cells to other agencies distorts both the data and, more often than not, policy outcomes. The data behind this graph is in Table 2.
The explosion of jail populations is the end result of a broader set of policies that have treated the criminal justice system as the default response to all kinds of social problems that the police and jails are ill-equipped to address. After decades of bad policy choices, it should be no surprise that jails are disproportionately filled with already-marginalized groups:
- 65% of the jail population meets medical standards for having a diagnosable substance abuse disorder.11
- 15.3% of the jail population reports being recently homeless compared to just 2.0% of the general population.12
- 52% of people in jail are people of color, compared to only 28% of the general population. Black people are jailed at 4x the rate of white people.13
- 7.7% of the adult jail population identifies as lesbian, gay, or bisexual, compared to 3.5% of the general population.14
This confinement creates problems for individuals on a short-term basis and also has long-term effects. Research in different jurisdictions has found people detained prior to trial, compared to similarly situated peers who are not detained, are:
- More likely to plead guilty.15
- More likely to be convicted.16
- More likely to be sentenced to jail.17
- More likely to have longer sentences if incarcerated.18
And these harms accrue quickly: being detained pre-trial for just 3 days can impact employment19, finances20, housing21, and the well-being of dependent children.22 In fact, studies have found that just 3 days of detention can make the lowest-risk defendants less likely to appear in court23 and more likely to commit new crimes.24 There is no question that wholesale pre-trial detention does far more harm than good.
Each of these individual harms can accumulate into community-wide harms when large numbers of individuals in the same community have the same experience. The hyper-incarceration of Black, Latino and other marginalized communities imposes subsequent challenges to success that other communities do not face.25 To be fair, these outcomes may not have been the intent of each state’s criminal laws, and these policies surely predate virtually every current elected official in the nation. But now that the pattern has been clearly identified, it is incumbent upon elected officials to change course. To do any less sends a clear signal that they approve of not only the current approach taken by jails in their state but the full course of negative outcomes that those policies create.
Renting jail space: a perverse incentive that fuels jail overgrowth
In more than half of U.S. states, there is another issue that makes talking about jails, and changing jail priorities, difficult. In those states, 10% or more of the people in jail are not “traditional jail inmates”26 at all, but people being held under contract for federal or state agencies. This both skews the data and gives local jail officials a powerful incentive to endorse policies that contribute to unnecessary jail expansion.
Some sharing of jail capacity can be about efficiency. If one county’s jail is occasionally full, borrowing space from a neighboring county is far superior to building a larger jail that will be empty almost all of the time. But the systematic renting of jail cells to other jurisdictions — and building ever-larger facilities in order to cash in on that market27— changes the priorities and the policies of jail officials.
Contracts with federal and state authorities allow local sheriffs to generate revenue from jails that are rarely filled with “traditional jail inmates.” Local officials can pad their law enforcement budgets by renting space to other authorities. This practice leaves sheriffs with little incentive to welcome or implement reforms.
This phenomenon is most visible in Louisiana, where the state has largely outsourced the construction and operation of state prisons to individual parish sheriffs. Just over half (52%) of the state’s prison population is housed under contract with local jails; and as a result two-thirds (67%) of the people held in Louisiana jails are not “traditional jail inmates.” Unlike other states, Louisiana’s jail building boom appears to have been entirely fueled by the pursuit of contracts with the state’s prison system.28
Louisiana parishes have, as a group, managed to refrain from growing their jail population. Unfortunately, should the state stop renting large amounts of jail space, Louisiana sheriffs would have the infrastructure in place to incarcerate tens of thousands more people. By allowing local officials to construct bigger facilities it opens the door for further growth in the traditional jail population. Any regressive future arrest, bail, or jail sentencing policies in Louisiana could mean that these facilities stay full.
Louisiana is extreme but not unique. Large portions of the jail population in Mississippi and Tennessee are people held for state authorities. Another major consumer of local jail cells is the federal government, starting with the U.S. Marshals Service that rents about 26,200 cells each year, mostly to hold federal pre-trial detainees in locations where there is no federal detention center. Immigration and Customs Enforcement also rents about 15,700 cells each year for people facing deportation—a number that new immigration policies may soon increase. There is wide variation in the amount of space rented to federal agencies: states have different levels of “excess” jail capacity and federal officials have specific needs in different parts of the country.
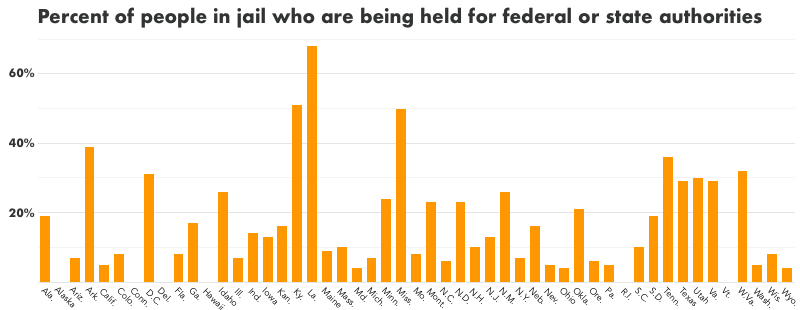
Figure 5. In 25 states, one out of every ten people in jail is actually being held for state or federal authorities. This slideshow reveals how much of each state’s reported jail population is actually the result of local officials renting jail bed space to different federal and state agencies. Data is not available for Alaska, Connecticut, Delaware, Hawaii, Rhode Island, and Vermont. The data behind this graph is in Table 2.
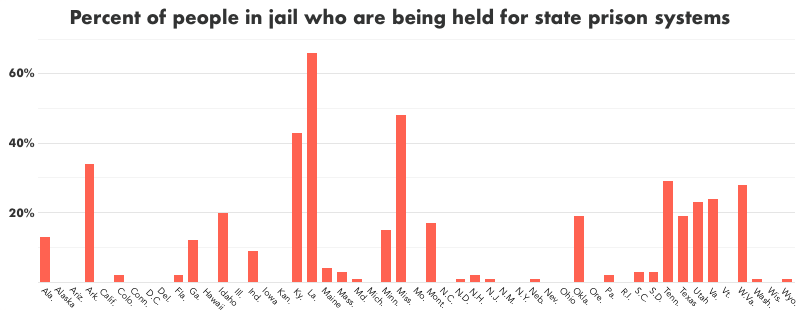
Figure 6. Just over 5% (86,620) of the national state prison population is not held in state prisons but under contract with local jails. Nationally, about 10% of jail space is used for state prison populations, but focusing on the national figures obscures that this is big business in a small number of states. Local jails in Kentucky, Louisiana, Tennessee, and Texas rent out 50,000 cells to their state prison systems. Data is not available for Alaska, Connecticut, Delaware, Hawaii, Rhode Island, and Vermont. The data behind this graph is in Table 2.
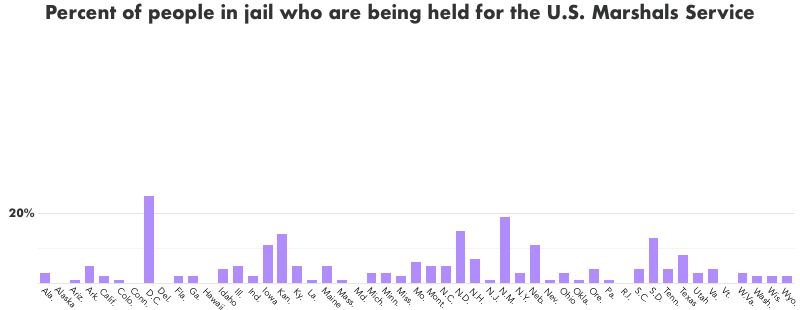
Figure 7. The U.S. Marshals Service holds people detained before federal trials, people serving short federal sentences, and convicted people being moved between federal prisons. Sometimes these people are held in a small number of Marshal Service or Bureau of Prisons facilities, but 44% (26,270) of people in Marshals Service custody are held under contract in local jails. Data is not available for Alaska, Connecticut, Delaware, Hawaii, Rhode Island, and Vermont. The data behind this graph is in Table 2.
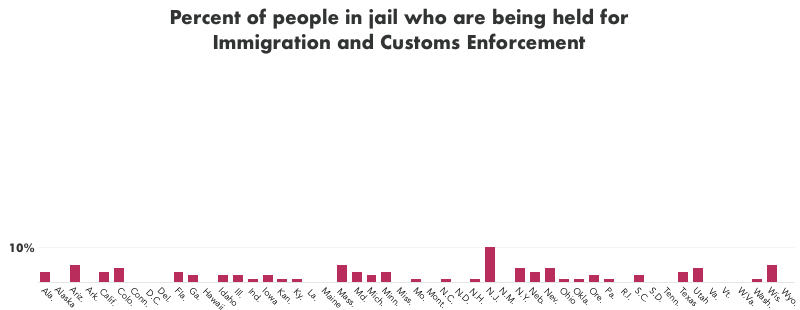
Figure 8. The federal Immigration and Customs Enforcement agency holds tens of thousands of people for immigration violations. Some are held in federal or private immigration detention centers, but more than 15,700 people are detained under contract with local jails. Change in this data point is particularly likely if the Trump Administration follows through with plans to increase the detention of immigrants because jails could theoretically absorb detainees more quickly than new federal facilities could be built to house more immigration detainees. Data is not available for Alaska, Connecticut, Delaware, Hawaii, Rhode Island, and Vermont. The data behind this graph is in Table 2.


- Federal & State
- State
- U.S. Marshals
- ICE
The systematic use of jails to house people for other agencies frustrates reform in other, more subtle ways by obscuring some of the basic policy metrics about jails. For example, figure 4 shows states like Louisiana and Kentucky as having relatively small pre-trial populations, which implies that those states have particularly enlightened bail policies. The more likely scenario is that the entire picture of those state’s jail population is distorted by the jail’s side businesses with state or federal agencies. There is no question that bail reform should be a priority in Louisiana, but the extent of that need is obscured by how the existing data is collected. Reform-minded state officials must address the two drivers of jail growth: misguided pre-trial policies and the financial incentives of state and federal contracts.
Recommendations
Local and state policies send people to jail almost 11 million times every year, but jails are largely off the public’s radar. If policymakers and state advocates want criminal justice reform they need to pay attention to jails, and we have ten recommendations for how they can break the cycle of using jails as catch-all responses to problems that disproportionately impact marginalized communities and people who are poor:
Change offenses and how offenses are treated
- States should reclassify criminal offenses and turn misdemeanor charges that don’t threaten public safety into non-jailable infractions.29
- For other offenses, states should create a presumption of citation, in lieu of arrests, for certain low-level crimes.30
- For low-level crimes where substance abuse and/or mental illnesses are involved, states should make treatment-based diversion programs the default instead of jail.31 States should also fully fund these diversion programs.32
Help people successfully navigate the criminal justice system to more positive outcomes
- States should immediately set up pilot projects to test promising programs that facilitate successful navigation of the criminal justice system. Community-based pretrial education programs, court notification systems, and other “wrap-around” pretrial services often increase court compliance while also reducing recidivism.33
Change policies that criminalize poverty or that create financial incentives for unnecessarily punitive policies
- States should encourage judges to use non-monetary sanctions, rather than fines and fees; and states should ensure that judges are holding indigency hearings before imposing and enforcing unaffordable fees.34
- States should ban for-profit probation and publish court-level data on probation fees.35
- States should eliminate the two-track system of justice by abolishing money bail. States unwilling to take that step should abolish the for-profit bail industry in their state, and provide technical resources to existing local-level bail alternative programs to help these programs self-evaluate and improve state-level knowledge.36
Monitor how local discretion has statewide effects
- States should actively monitor how local prosecutorial decisions impact state-level prison populations and also require prosecutors to collect and publish aggregate data on bail decisions, charging decisions, and other measures to allow analysis of whether prosecutorial discretion is magnifying racial disparities or increasing the state’s prison population.37
Explore ways to advance justice by clearing court backlogs
- States struggling with particularly backlogged courts should create a procedure to dismiss old, minor criminal cases.38
Address the troubling trend of renting jail space
- States — particularly Alabama, Kansas, Kentucky, Louisiana, Mississippi, New Jersey, New Mexico, North Dakota, Tennessee, and Utah — should evaluate whether the renting of local jail space to state and federal authorities is steering local officials away from effectively addressing local needs.39
State graphs
The graphs made for this briefing are included in our profiles for each state:
and are available individually from this list:
- Jail and prison incarceration rates in Alabama, 1978-2015
- Jail and prison population in Alabama, 1978-2015
- Jail conviction status in Alabama 1978-2013
- Jail and prison incarceration rates in Arizona, 1978-2015
- Jail and prison population in Arizona, 1978-2015
- Jail conviction status in Arizona 1978-2013
- Jail and prison incarceration rates in Arkansas, 1978-2015
- Jail and prison population in Arkansas, 1978-2015
- Jail conviction status in Arkansas 1978-2013
- Jail and prison incarceration rates in California, 1978-2015
- Jail and prison population in California, 1978-2015
- Jail conviction status in California 1978-2013
- Jail and prison incarceration rates in Colorado, 1978-2015
- Jail and prison population in Colorado, 1978-2015
- Jail conviction status in Colorado 1978-2013
- Jail and prison incarceration rates in Florida, 1978-2015
- Jail and prison population in Florida, 1978-2015
- Jail conviction status in Florida 1978-2013
- Jail and prison incarceration rates in Georgia, 1978-2015
- Jail and prison population in Georgia, 1978-2015
- Jail conviction status in Georgia 1978-2013
- Jail and prison incarceration rates in Idaho, 1978-2015
- Jail and prison population in Idaho, 1978-2015
- Jail conviction status in Idaho 1978-2013
- Jail and prison incarceration rates in Illinois, 1978-2015
- Jail and prison population in Illinois, 1978-2015
- Jail conviction status in Illinois 1978-2013
- Jail and prison incarceration rates in Indiana, 1978-2015
- Jail and prison population in Indiana, 1978-2015
- Jail conviction status in Indiana 1978-2013
- Jail and prison incarceration rates in Iowa, 1978-2015
- Jail and prison population in Iowa, 1978-2015
- Jail conviction status in Iowa 1978-2013
- Jail and prison incarceration rates in Kansas, 1978-2015
- Jail and prison population in Kansas, 1978-2015
- Jail conviction status in Kansas 1978-2013
- Jail and prison incarceration rates in Kentucky, 1978-2015
- Jail and prison population in Kentucky, 1978-2015
- Jail conviction status in Kentucky 1978-2013
- Jail and prison incarceration rates in Louisiana, 1978-2015
- Jail and prison population in Louisiana, 1978-2015
- Jail conviction status in Louisiana 1978-2013
- Jail and prison incarceration rates in Maine, 1978-2015
- Jail and prison population in Maine, 1978-2015
- Jail conviction status in Maine 1978-2013
- Jail and prison incarceration rates in Maryland, 1978-2015
- Jail and prison population in Maryland, 1978-2015
- Jail conviction status in Maryland 1978-2013
- Jail and prison incarceration rates in Massachusetts, 1978-2015
- Jail and prison population in Massachusetts, 1978-2015
- Jail conviction status in Massachusetts 1978-2013
- Jail and prison incarceration rates in Michigan, 1978-2015
- Jail and prison population in Michigan, 1978-2015
- Jail conviction status in Michigan 1978-2013
- Jail and prison incarceration rates in Minnesota, 1978-2015
- Jail and prison population in Minnesota, 1978-2015
- Jail conviction status in Minnesota 1978-2013
- Jail and prison incarceration rates in Mississippi, 1978-2015
- Jail and prison population in Mississippi, 1978-2015
- Jail conviction status in Mississippi 1978-2013
- Jail and prison incarceration rates in Missouri, 1978-2015
- Jail and prison population in Missouri, 1978-2015
- Jail conviction status in Missouri 1978-2013
- Jail and prison incarceration rates in Montana, 1978-2015
- Jail and prison population in Montana, 1978-2015
- Jail conviction status in Montana 1978-2013
- Jail and prison incarceration rates in Nebraska, 1978-2015
- Jail and prison population in Nebraska, 1978-2015
- Jail conviction status in Nebraska 1978-2013
- Jail and prison incarceration rates in Nevada, 1978-2015
- Jail and prison population in Nevada, 1978-2015
- Jail conviction status in Nevada 1978-2013
- Jail and prison incarceration rates in New Hampshire, 1978-2015
- Jail and prison population in New Hampshire, 1978-2015
- Jail conviction status in New Hampshire 1978-2013
- Jail and prison incarceration rates in New Jersey, 1978-2015
- Jail and prison population in New Jersey, 1978-2015
- Jail conviction status in New Jersey 1978-2013
- Jail and prison incarceration rates in New Mexico, 1978-2015
- Jail and prison population in New Mexico, 1978-2015
- Jail conviction status in New Mexico 1978-2013
- Jail and prison incarceration rates in New York, 1978-2015
- Jail and prison population in New York, 1978-2015
- Jail conviction status in New York 1978-2013
- Jail and prison incarceration rates in North Carolina, 1978-2015
- Jail and prison population in North Carolina, 1978-2015
- Jail conviction status in North Carolina 1978-2013
- Jail and prison incarceration rates in North Dakota, 1978-2015
- Jail and prison population in North Dakota, 1978-2015
- Jail conviction status in North Dakota 1978-2013
- Jail and prison incarceration rates in Ohio, 1978-2015
- Jail and prison population in Ohio, 1978-2015
- Jail conviction status in Ohio 1978-2013
- Jail and prison incarceration rates in Oklahoma, 1978-2015
- Jail and prison population in Oklahoma, 1978-2015
- Jail conviction status in Oklahoma 1978-2013
- Jail and prison incarceration rates in Oregon, 1978-2015
- Jail and prison population in Oregon, 1978-2015
- Jail conviction status in Oregon 1978-2013
- Jail and prison incarceration rates in Pennsylvania, 1978-2015
- Jail and prison population in Pennsylvania, 1978-2015
- Jail conviction status in Pennsylvania 1978-2013
- Jail and prison incarceration rates in South Carolina, 1978-2015
- Jail and prison population in South Carolina, 1978-2015
- Jail conviction status in South Carolina 1978-2013
- Jail and prison incarceration rates in South Dakota, 1978-2015
- Jail and prison population in South Dakota, 1978-2015
- Jail conviction status in South Dakota 1978-2013
- Jail and prison incarceration rates in Tennessee, 1978-2015
- Jail and prison population in Tennessee, 1978-2015
- Jail conviction status in Tennessee 1978-2013
- Jail and prison incarceration rates in Texas, 1978-2015
- Jail and prison population in Texas, 1978-2015
- Jail conviction status in Texas 1978-2013
- Jail and prison incarceration rates in Utah, 1978-2015
- Jail and prison population in Utah, 1978-2015
- Jail conviction status in Utah 1978-2013
- Jail and prison incarceration rates in Virginia, 1978-2015
- Jail and prison population in Virginia, 1978-2015
- Jail conviction status in Virginia 1978-2013
- Jail and prison incarceration rates in Washington, 1978-2015
- Jail and prison population in Washington, 1978-2015
- Jail conviction status in Washington 1978-2013
- Jail and prison incarceration rates in West Virginia, 1978-2015
- Jail and prison population in West Virginia, 1978-2015
- Jail conviction status in West Virginia 1978-2013
- Jail and prison incarceration rates in Wisconsin, 1978-2015
- Jail and prison population in Wisconsin, 1978-2015
- Jail conviction status in Wisconsin 1978-2013
- Jail and prison incarceration rates in Wyoming, 1978-2015
- Jail and prison population in Wyoming, 1978-2015
- Jail conviction status in Wyoming 1978-2013
Methodology
Jails are, by definition, a distributed mess of “systems” so getting the data is hard. Jails often hold people for other (state and federal) agencies, and at times the numbers can be large enough to obscure the results of state and local level policy changes, so this report takes the time to separate out people held in jails for state prison systems or federal agencies, such as Immigration and Customs Enforcement, the Bureau of Prisons, the U.S. Marshals Service, and the Bureau of Indian Affairs.
Our national data comes from our own analysis of the Bureau of Justice Statistics datasets National Jail Census Series and the Annual Survey of Jails that, taken together, provide the most complete annual snapshot of jail populations. Our state-level data is from the National Jail Census for the years 1983, 1988, 1993, and 1999 and the Deaths in Custody Reporting Series for the years 2000-2013. (We considered using the Annual Survey of Jails for our state-level data, but the Bureau of Justice Statistics explains that this dataset was “designed to produce only national estimates”40 and after much testing we concluded that this dataset could not reliably be used for state-level summaries.)
Jails — or facilities that serve the functions of jails — operate in all states, but in 6 states (Alaska, Connecticut, Delaware, Hawaii, Rhode Island, and Vermont) most or all of the jail system is integrated into the state prison system, so the “jail” populations in those states are not reflected in the federal data products on which this report relies.41 For that reason, we are unable to report state-specific data for those states, and except for a small number of people held in locally operated Alaska jails, those states are not included in the national totals reported in this report. Because these six states are relatively small states, we do not think their exclusion meaningfully impacts the national totals nor the much more important analysis of the trends within the national totals.
Many of our data sources are labeled on the individual graphics, but in some cases we had to combine multiple datasets or perform complicated adjustments where additional detail would be helpful to other researchers and advocates:
National data:
- National number of people held in local jails for state and federal agencies (aka boarding/renting): This is the sum of the number of people held for federal and state agencies:
- National number of people held in local jails for all of the various federal authorities, including Immigration and Customs Enforcement (ICE), the Bureau of Prisons (BOP), the U.S. Marshals Service and the Bureau of Indian Affairs: For 1983, 1988 and 1993, we used the National Jail Census Series and for 2002, 2008 and 2013 we used the Annual Survey of Jails Series. For 1998, the Annual Survey of Jails did not provide a separate count of people held for INS (now ICE), so for that year only we supplemented with INS counts of immigration detainees held in local jails in 1998 made available at: “Questions and Answers Regarding INS Detention Facilities, October 2, 1998”, Detention and Deportation Staff, U.S. Department of Justice. Unfortunately, this report was not able to use data from the 2015 version of the Annual Survey of Jails because, as of press time in May 2017, the necessary raw data has not yet been released.
- National number of people held in local jails for state authorities: The Bureau of Justice Statistics, Prisoners Series (1983-2013) publishes the number of people held in local jails for state authorities. (This data point is also collected in the Census of Jails and the Annual Survey of Jails but we concluded, after much study, that the Prisoners Series, which collects the data directly from a state's Departments of Corrections, was more reliable.)
- National pre-trial and jail sentenced populations: Total numbers for each category are reported in the National Jail Census Series (1983, 1988, 1993, 1999, 2005, 2013) and the Annual Survey of Jails Series (for all other years, except 1994 for which conviction status data is unavailable but can be imputed as the average of the 1993 and 1995 values). We then adjusted the reported figures for the convicted and unconvicted populations to remove those held for other agencies from these jail totals.
- We removed 100% of people held for state prison systems from the jail convicted totals.
- We removed 34.1% of the people being held under the authority of Immigration and Customs Enforcement from the jail convicted population and removed the balance from the jail unconvicted population. (We based these percentages of the population held for ICE on our analysis of the “Profile of Jail Inmates, 2002”.42 We found 34.1% of ICE detainees were there “to await sentencing for an offense”, “to await transfer to serve a sentence somewhere else”, “to serve a sentence in this jail” or “to await a hearing for revocation of probation/parole or community release.”) This percentage calculation ignored any respondent who did not answer the question, and counted anyone who answered both a “convicted” and “unconvicted” status as convicted. We deliberately used this methodology which counts those awaiting revocation hearings as “convicted” because that matches the methodology used in our main datasets for this project: the Annual Survey of Jails and the National Jail Census. (Not surprisingly, since the ICE detainees are answering a survey intended for criminal justice populations, the leading response (41%) for ICE detainees about why they are being held in jail is, after being read a list of criminal justice statuses like “to serve a sentence” or “to await arraignment” is to answer “for another reason.”)
- We removed 75.9% of the people being held for either the Bureau of Prisons or the U.S. Marshals Service from the jail convicted population and we removed the balance from the jail unconvicted population. (We based these percentages on our analysis of the “Profile of Jail Inmates, 2002” as described above for the ICE detainees).
State data:
Our jail trends comparisons (figures 2-8) are based on the National Jail Census Series, and figures 5 and 6 in our slideshow also use data from the Prisoners Series. Our state-specific, over time, data on prisons, jails and the changes in jail composition pull from several different data sources:
- For the state-level graphs on the prison and jail population, the number of people in state prisons comes from the Bureau of Justice Statistics, Correctional Statistical Analysis Tool and the jail populations are based on the National Jail Census Series for the years 1978, 1983, 1988, 1993, and 1999, and the Deaths in Custody Reporting Series for each year from 2000 through 2013. (Values for the years between periodic Census of Jails years were imputed.) As described above, our jail population totals were adjusted to remove people held for state or federal authorities in order to focus on those held by local authorities under local jurisdiction.
- For the state-level graphs on prison and jail incarceration rates, for the jail populations in each state we divided the above (adjusted) numbers by the July 1st U.S. Census Bureau’s Census Vintage Population Estimates, which we have published in Table 6, and multiplied the result by 100,000 to show an incarceration rate per 100,000 people in each state for each year on the graph. Our state prison incarceration rates come from the Bureau of Justice Statistics, Correctional Statistical Analysis Tool.
- For the state graphs of the number of people incarcerated in local jails by conviction status, we devised estimates of the number of people held for local authorities by conviction status without including people held for other authorities. The National Jail Census does not report the conviction status of people held for other authorities separately from those held for local authorities, so we based our estimate on the only reported ratio of convicted/unconvicted which includes the entire custody population. (We concluded that our national estimates of the portion of people held for state prisons or various federal agencies that are convicted or unconvicted were not reliable at the state level, so we used a simpler methodology for our state graphs.) We used each year of the National Jail Census Series (1978, 1983, 1988, 1993, 1999, 2005 and 2013) to first determine the percentages of all people being held in each state who were convicted and unconvicted. We then subtracted the number of people held for state or federal authorities from the total, and applied our percentage convicted/unconvicted to the remainder. Because most people in jails being held for other authorities are convicted, we believe, our figures likely undercount the unconvicted/pre-trial populations and overcount the convicted populations.
For the six states where the federal government can not provide jail counts or conviction status data, we updated only the state prison portions of the graphs.
Appendices
- Table 1. U.S. jail conviction status
- Table 2. Jail trends by state
- Table 3. Jail conviction status over time by state
- Table 4. Jail and prison incarceration rates over time by state
- Table 5. Jail and prison incarcerated populations over time by state
- Table 6. July 1 state population estimates
Footnotes
Bureau of Justice Statistics, Jail Inmates in 2015, Table 1 (December 2016). ↩
D. Liebelson and Ryan J. Reilly, “Sandra Bland Died One Year Ago and Since Then, At Least 810 People Have Lost their Lives in Jail”, Huffington Post (June 13 2016). ↩
When he was 16 years old, Kalief Browder was held in New York’s Rikers Island jail for three years, including almost two years in solitary confinement. M. Schwirtz and M. Winerip, “Kalief Browder, Held at Rikers Island for 3 Years Without Trial, Commits Suicide”, The New York Times (June 8 2015). ↩
63% of all 720,300 people in jail, as of 2015 were pre-trial. Bureau of Justice Statistics, Jail Inmates in 2015 (December 2016). Using the most recent jail data that can be adjusted by removing the people being held by federal and state authorities, from 2013, 73% of 596,500 people in jail for local authorities were pre-trial. See Figure 1. ↩
See Figure 1. The confined jail population—everyone being physically held in a jail—has more than tripled and what we call the “traditional jail” population has nearly tripled, which includes people convicted of and awaiting trial for minor crimes, and excludes people being held for federal and state authorities, such as Immigration and Customs detainees. ↩
For international incarceration rates see R. Walmsley, Institute for Criminal Policy Research, World Prison Population List (11th edition, 2016). The international figures include all individuals who have been convicted of crimes, and sentenced to any length of incarceration, and those who are being held pre-trial or on “remand.” ↩
For example, state lawmakers are well positioned to regulate commercial bail bondsmen, but especially since the 1990s, bail bondsmen have operated in a largely unregulated industry. S. Bauer, “Inside the Wild, Shadowy, and Highly Lucrative Bail Industry”, Mother Jones (June 2014). ↩
99% of jail growth in the last 15 years has been in the pre-trial population. ↩
For example, among juveniles that encounter the police in 1979, the police referred only 3.8% of juveniles to criminal court and 36.6% of juveniles were handled within police departments and then released. By 2011 (the most recent year data is available) the police referred 7.3% of juveniles to criminal court and 22.0% of juveniles were handled within police departments and then released. Bureau of Justice Statistics, Sourcebook of Criminal Justice Statistics 2011, Table 4.26 (2011). For more on police practices, see the Justice Policy Institute report, Rethinking the Blues: How We Police in the U.S. and at What Cost (May 2012). ↩
From 1990-2009, the average bail amount more than doubled, going from approximately $25,000 to $55,000. Bureau of Justice Statistics, Felony Defendants in Large Urban Counties, 2009 - Statistical Tables (December 2013). For more on the history of bail policies, see Pretrial Justice Institute, The History of Bail and Pretrial Release, (September 2010). ↩
Data collected in 2002 found that 68% of people in jails reported symptoms that met medical substance abuse criteria. J. Karberg and D. James, Bureau of Justice Statistics Special Reports, “Substance Dependence, Abuse, and Treatment of Jail Inmates 2002”, (July 2005). ↩
A national survey of jail inmates found that people in jail are anywhere from 7.5 to 11.3 times more likely to have been recently homeless than the general population. G. Greenberg and R. Rosenheck, “Jail incarceration, homelessness, and mental health: a national study”, Psychiatric Services: A Journal of the American Psychiatric Association (February 2008). ↩
Calculated from Bureau of Justice Statistics, Jail Inmates in 2015, Table 1 (December 2016), and data from the U.S. Census, “Annual Estimates of the Resident Population by Sex, Race Alone or in Combination, and Hispanic Origin for the United States, States, and Counties: April 1, 2010 to July 1, 2015” (data now goes through 2019). The jail incarceration rate for Black people is 529.9 per 100,000 people, compared to a jail incarceration rate for white people of 131.3 and a U.S. jail incarceration rate of 209.8. ↩
7.7% of adults reported being lesbian, gay, or bisexual in the Bureau of Justice Statistics, National Inmate Survey (2011-2012) (May 2013), while an aggregate of surveys found that only 3.5% of adults in the general population reported being lesbian, gay, or bisexual. G. Gates, The Williams Institute, “LGBT Demographics: Comparisons among population-based surveys”, (October 2014). Research indicates that lesbian, gay, bisexual, and transgender people are not only disproportionately incarcerated in local jails, but also experience high rates of abuse behind bars. For example, 34% of transgender adults in jail reported being sexually victimized by another inmate or facility staff in jail: Bureau of Justice Statistics, Sexual Victimization in Prisons and Jails Reported by Inmates (2013). ↩
P. Heaton, S. Mayson, and M. Stevenson, Stanford Law Review, “The Downstream Consequences of Misdemeanor Pretrial Detention”, (March 2017). ↩
M. Stevenson, “Distortion of Justice: How Inability to Pay Bail Affects Case Outcomes”, (8 January 2017). For further reference see M.T. Phillips, New York City Criminal Justice Agency, A Decade of Bail Research in New York City, (August 2012). ↩
C. Oleson, C.T. Lowenkamp, J. Wooldredge, M. Van Nostrand, and T.P. Cadigan, Crime and Delinquency, “The sentencing consequences of Federal Pretrial supervision”, (26 September 2014). ↩
M. Sacks and A.R. Ackerman, Criminal Justice Policy Review, “Bail and sentencing: Does pretrial detention lead to harsher punishment”, (January 2014). For further reference see C.T. Lowenkamp, M. VanNostrand, and A. Holsinger, Laura and John Arnold Foundation, “Investigating the Impact of Pretrial Detention on Sentencing Outcomes”, (November 2013). ↩
In a comparison of defendants detained for more than 3 days and less than 3 days, researchers found “pretrial detention had deleterious effects, to some degree, for all defendants involved in the study.” A. Holsigner, Crime and Justice Institute, “Analyzing Bond Supervision Survey Data: The Effects of Pretrial on Self-Reported Outcomes”, Table 2 (June 2016). For further reference see the Open Society Foundation report Socioeconomic Impact of Pretrial Detention, (2011). ↩
A. Holsinger, Crime and Justice Institute, “Analyzing Bond Supervision Survey Data: The Effects of Pretrial on Self-Reported Outcomes”, Table 3 (June 2016). ↩
A. Holsinger, Crime and Justice Institute, “Analyzing Bond Supervision Survey Data: The Effects of Pretrial on Self-Reported Outcomes”, Table 4 (June 2016). ↩
A. Holsinger, Crime and Justice Institute, “Analyzing Bond Supervision Survey Data: The Effects of Pretrial on Self-Reported Outcomes”, Table 5 (June 2016). ↩
C.T. Lowenkamp, M. VanNostrand, and A. Holsinger, Laura and John Arnold Foundation, “Investigating the Impact of Pretrial Detention on Sentencing Outcomes”, (November 2013). Alternatives to pretrial detention, such as call systems reminding people of court dates, have been shown to be equally or more successful at getting people to appear in court. See Justice Policy Institute, Bail Fail: Why the U.S. Should End The Practice of Using Money for Bail, (September 2012). ↩
P. Heaton, S. Mayson, and M. Stevenson, Stanford Law Review "The Downstream Consequences of Misdemeanor Pretrial Detention", (March 2016). ↩
For example, see R. Brewer and N. Heitzeg, American Behavioral Scientist, The Racialization of Crime and Punishment: Criminal Justice, Color-Blind Racism, and the Political Economy of the Prison Industrial Complex, (1 January 2008) and M.L. Hatzenbuehler, K. Keyes, A. Hamilton, M. Uddin, and S. Galea, American Journal of Public Health “The Collateral Damage of Mass Incarceration; Risk of Psychiatric Morbidity Among Nonincarcerated Residents of High-Incarceration Neighborhoods”, (January 2015). For further reference, see J. Guo, “America has locked up so many black people it has warped our sense of reality”, Washington Post, (26 February 2016). ↩
By “traditional jail inmates” we mean people who are both in the custody and jurisdiction of the local jail—they are detained pre-trial for or have been convicted of and are serving a sentence for a crime typically punishable by less than a year of incarceration. ↩
For example, officials in Blount County, Tennessee used “jail overcrowding” to justify a proposal for jail expansion. A deeper analysis, however, revealed that the county’s jail was overcrowded in large part because it was renting space to the state prison system. The county has now cut back on renting space to the state prison system and is exploring other ways to reduce its jail population. See J. Davis, “State to move 99 Blount County prisoners to other facilities”, The Daily Times (28 June 2016), and L. Bales-Sherrod, “Blount County Corrections Partnership chooses jail consultant, committee recommends pick to Blount County Commission”, The Daily Times, (29 March 2017). ↩
As The Times-Picayune has explained “In the early 1990s, when the incarceration rate was half what it is now, Louisiana was at a crossroads. Under a federal court order to reduce overcrowding, the state had two choices: Lock up fewer people or build more prisons…It achieved the latter, not with new state prisons — there was no money for that — but by encouraging sheriffs to foot the construction bills in return for future profits.” C. Chang, “Louisiana is the world’s prison capital”, The Times-Picayune, (May 13 2012). ↩
For example California, Massachusetts, and Ohio in recent years have reduced offenses from minor misdemeanors to non-jailable infractions. Spangenberg Project and Center for Justice, Law, and Society at George Mason University, “An Update on State Efforts in Misdemeanor Reclassification, Penalty Reduction, and Alternative Sentencing”, (September 2010). ↩
For example, 10 states have citation in lieu of arrest state laws in place: California, Kentucky, Maryland, Minnesota, New Jersey, New York, Ohio, Pennsylvania, Tennessee, and Virginia. See the National Conference of State Legislatures, 50 State Chart on Citation In Lieu of Arrest, last updated on March 13, 2013. ↩
For example, in Pima County, Arizona, as part of the MacArthur Foundation’s Safety and Justice Challenge, officials have begun screening people for mental health and substance abuse concerns who are arrested before their initial court appearance. The Safety and Justice Challenge is a $100 million initiative by the John D. and Catherine T. MacArthur Foundation to help local justice systems reduce their reliance on jails and develop alternatives to incarceration. The Challenge has inspired a number of other diversion programs, such as Law Enforcement Assisted Diversion (LEAD) programs, in counties like Multnomah County, Oregon, which coordinates the efforts of local law enforcement agencies with community-based service providers. For more on LEAD programs, see the Addiction Policy Forum, Center for Health and Justice, National Criminal Justice Association “Innovation Spotlight: Law Enforcement Assisted Diversion”, (February 2017). ↩
For example, diversion programs have been shown to be a cost-saving reform by reducing caseloads, but are often defunded due to budget shortfalls. See A.N. Kitchen, Criminal Law Bulletin, “When Pre-Trial Diversion Programs Disappear: The Need To Protect Diverted Defendants’ Due Process and Liberty Rights” (February 27 2017). States creating these programs should also ensure that diversion programs don’t turn into revenue-generating schemes. See S. Dewan and A. Lehren, “After a Crime, the Price of a Second Chance”, The New York Times, (December 12 2016). ↩
For example, the Kentucky Alternative Sentencing Worker Program connects individuals with social workers throughout the criminal justice process. ↩
For example, while these hearings are required by Texas state law, investigations have found that judges often aren’t holding poverty hearings. K. Taggert and A. Campbell, “In Texas It’s A Crime To Be Poor”, BuzzFeed News, (October 15 2015). For further reference, a 2016 report from the Massachusetts Senate found that judges were rarely inquiring whether defendants could afford to pay criminal justice related fines and fees: Massachusetts Senate Post Audit and Oversight Committee, “Fine Time Massachusetts: Judges, Poor People, and Debtors’ Prison in the 21st Century”, (November 7 2016). ↩
For example, after the American Civil Liberties Union filed suit, new court procedures in Biloxi, Mississippi have reigned in exploitation embedded in the for-profit probation industry. See Kennedy v. City of Biloxi (Settlement Agreement), (March 15 2016). ↩
For example, four states have abolished commercial bail: Illinois, Kentucky, Oregon, and Wisconsin. A. Santo, “When Freedom Isn’t Free”, The Marshall Project, (February 2 2015). For further reference see A. Liptak “Illegal Globally, Bail for Profit Remains in U.S.”, The New York Times, (January 29 2008). ↩
For example, research on prosecutorial discretion indicates that there are a number of stages where racial bias can impact decision-making. B. Kutateladze, V. Lynn, and E. Liang, Vera Institute for Justice, Do Race and Ethnicity Matter in Prosecution: A Review of Empirical Studies, (June 2012). ↩
For example, the New Mexico Supreme Court introduced rules limiting court delays in order to deal with approximately 3,000 backlogged cases. See M. Gallagher, “New rule aims to unclog courts, cut jail population”, Albuquerque Journal, (November 13 2014). ↩
For example, a recent California bill would prevent local jails from receiving state grant funding that is intended for expanding and improving jail facilities if those expansions were for the purpose of renting space to Immigration and Customs Enforcement. See G. Edevane, “‘The Feds Can Build Their Own Facilities’: State Bill Would Limit Expansion Funds to Jails That Lease to ICE”, NBC Los Angeles, (April 29 2017). ↩
Bureau of Justice Statistics, Correctional Populations in the United States, 2014, p. 12. ↩
In 5 states (Connecticut, Delaware, Hawaii, Rhode Island, Vermont) the system is entirely integrated. In Alaska, there are a number of locally operated jails not a part of the state system, and so available Alaska data reflects just the locally operated jails and not the entire jail population. We included the available Alaska data from the locally operated jails in our national figures, but not in any state-specific graphs. ↩
This is the most recent data available until the Bureau of Justice Statistics begins administering the next Survey of Inmates in Local Jails in 2018. ↩
About the Prison Policy Initiative
The non-profit non-partisan Prison Policy Initiative was founded in 2001 to expose the broader harm of mass criminalization and spark advocacy campaigns to create a more just society. The organization is most well-known for its big-picture publication Mass Incarceration: The Whole Pie that helps the public more fully engage in criminal justice reform. This report builds upon the organization’s 2016 analysis of the cycle of poverty and jail incarceration, Detaining the Poor.
About the author
Joshua Aiken is the Policy Fellow at the Prison Policy Initiative. Joshua produced the national report Reinstating Common Sense that documented nearly 200,000 driver’s licenses suspended annually for non-driving drug offenses. Joshua also curates the Research Clearinghouse, a database of empirical research on criminal justice issues.
Acknowledgements
This report was made possible by the generous support of the John D. and Catherine T. MacArthur Foundation’s Safety and Justice Challenge, the Public Welfare Foundation, and our individual donors. The MacArthur Foundation’s Safety and Justice Challenge is an initiative to reduce over-incarceration by changing the way America thinks about and uses jails. The initiative—an initial five-year, $100 million investment by the John D. and Catherine T. MacArthur Foundation—features a competition to help jurisdictions across the country create fairer, more effective local justice systems.
The author wishes to thank his Prison Policy Initiative colleagues Peter Wagner, Aleks Kajstura, Bernadette Rabuy, Wendy Sawyer, and Lucius Couloute for their feedback and assistance in the drafting of this report and John Boston, Nora Demleitner, Alex Friedmann, Deborah Golden, Jacob Kang-Brown, Bruce Reilly, Sarah Schirmer, Margo Schlanger and Carl Takei for sharing their expertise with particular aspects of jail, sentencing and criminal justice data systems.
Recommended Reading:

Advocacy Toolkit
Resources, tips, and best practices to help advocates working to end mass incarceration.

50 state incarceration profiles
All of our recent reports about prison/jail growth, racial disparities, and more, re-organized by state.

Mass Incarceration: The Whole Pie
The U.S. incarcerates nearly 2 million people. Where are they locked up and why? Read our report.

Events
- April 15-17, 2025:
Sarah Staudt, our Director of Policy and Advocacy, will be attending the MacArthur Safety and Justice Challenge Network Meeting from April 15-17 in Chicago. Drop her a line if you’d like to meet up!
Not near you?
Invite us to your city, college or organization.