Data Source: For source and methodology details, see: www.prisonpolicy.org/reports/covidspread.html. (Graph: Wendy Sawyer, 2020)
This graph originally appeared in Mass Incarceration, COVID-19, and Community Spread.
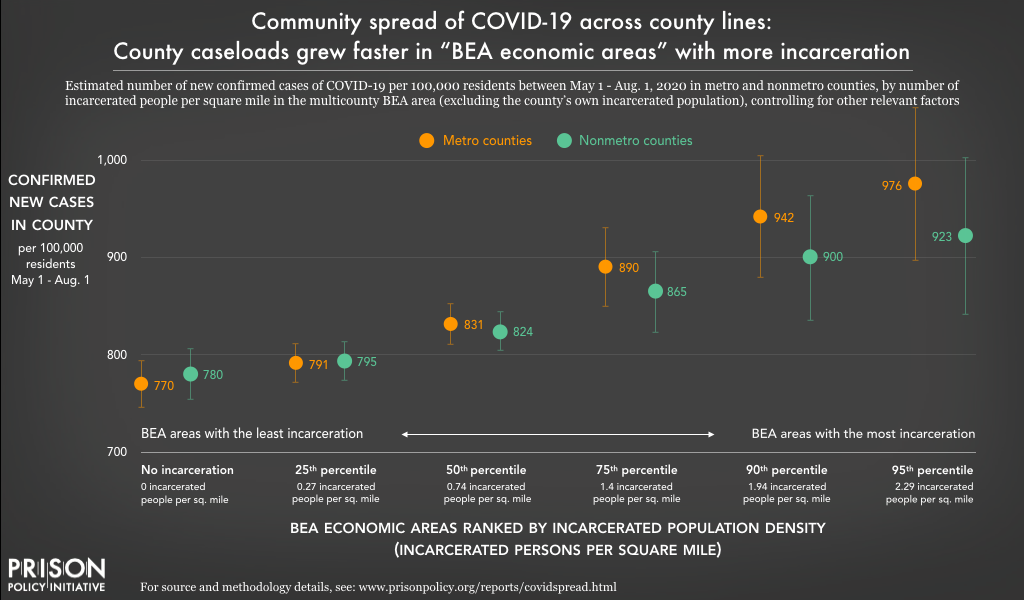
The number of COVID-19 cases, per 100,000 residents, expected in counties between May 1 and August 1, depending on the number of incarcerated people per square mile in all other counties in the BEA economic area (controlling for other relevant factors). Each county’s own incarcerated population is excluded from the BEA-level measure of incarceration. This chart displays point estimates (as circles), and the upper and lower bounds of the 95% confidence interval (the vertical lines). This chart shows that for both metro and nonmetro counties, being located within a multicounty BEA economic area with a higher incarcerated population density (such as an area with multiple large prisons or jails) was associated with more new cases of the novel coronavirus from May 1 to August 1, 2020 — even when completely disregarding the county’s own incarcerated population. The effect of being located in a high-incarceration economic area was stronger for metro counties (shown in orange) than for nonmetro counties (shown in green).
Events
- April 15-17, 2025:
Sarah Staudt, our Director of Policy and Advocacy, will be attending the MacArthur Safety and Justice Challenge Network Meeting from April 15-17 in Chicago. Drop her a line if you’d like to meet up!
Not near you?
Invite us to your city, college or organization.


