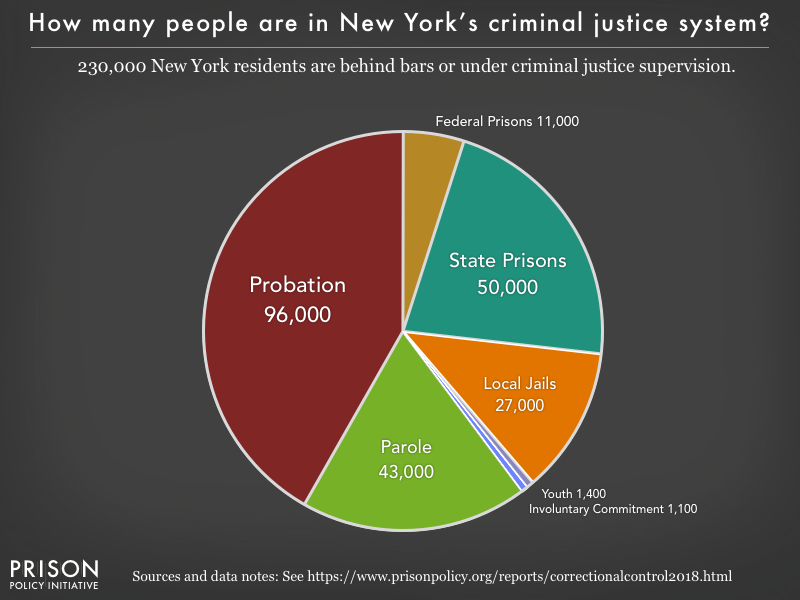
(Graph: Alexi Jones, December 2018)
This graph is a part of Correctional Control 2018: Incarceration and supervision by state. For more research and graphs about New York, see our New York state profile.


Events
- April 15-17, 2025:
Sarah Staudt, our Director of Policy and Advocacy, will be attending the MacArthur Safety and Justice Challenge Network Meeting from April 15-17 in Chicago. Drop her a line if you’d like to meet up!
Not near you?
Invite us to your city, college or organization.