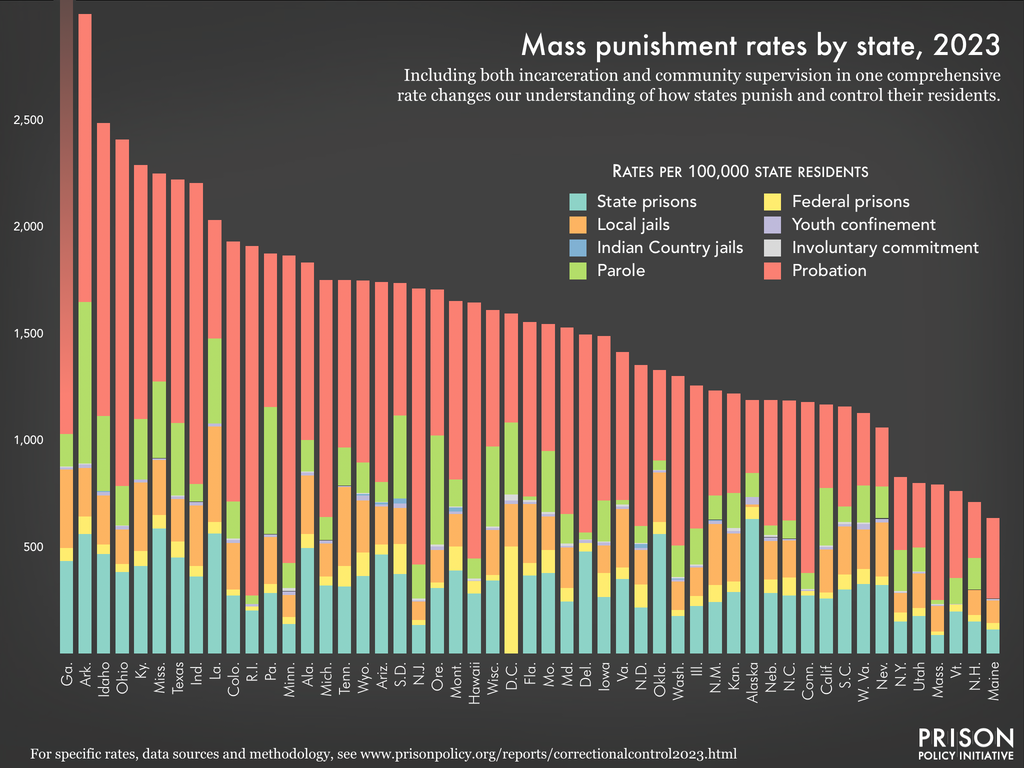
Data Source: For source data, see the report's methodology section. (Graph: Leah Wang, 2023)
This graph originally appeared in Punishment Beyond Prisons 2023: Incarceration and supervision by state.
Overall rates of mass punishment include state prisons, federal prisons, local jails, youth confinement, Indian Country jails, involuntary commitment, parole and probation. Rates are per 100,000 residents in that state, D.C., or, for the U.S. overall. Scroll right to see the relative mass punishment rates for each of these systems, and see the Data Appendix for the complete data set, including counts and rates for each system in each state and the U.S. overall.
Events
- April 15-17, 2025:
Sarah Staudt, our Director of Policy and Advocacy, will be attending the MacArthur Safety and Justice Challenge Network Meeting from April 15-17 in Chicago. Drop her a line if you’d like to meet up!
Not near you?
Invite us to your city, college or organization.


