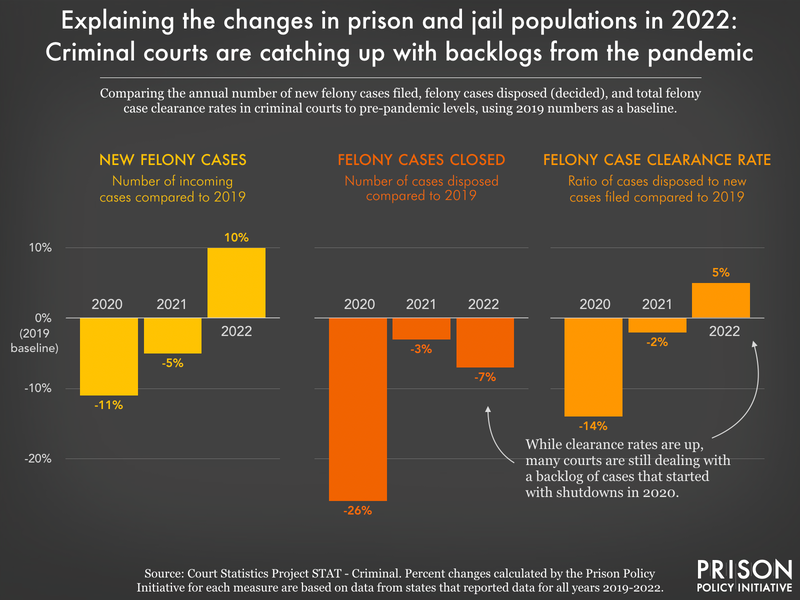
Data Source: Court Statistics Project STAT Criminal. Percent changes calculated by the Prison Policy Initiative based on data from states that reported data for all years 2019-2022. (Graph: Wendy Sawyer, 2023)
This graph originally appeared in Why did prison and jail populations grow in 2022 — and what comes next?.
In 2020, many courts shut down jury trials and other in-person operations, creating a backlog of cases that are still being cleared in many states. As more cases work their way through the courts, more people are sentenced to incarceration, resulting in more prison admissions.
Events
- April 15-17, 2025:
Sarah Staudt, our Director of Policy and Advocacy, will be attending the MacArthur Safety and Justice Challenge Network Meeting from April 15-17 in Chicago. Drop her a line if you’d like to meet up!
Not near you?
Invite us to your city, college or organization.


