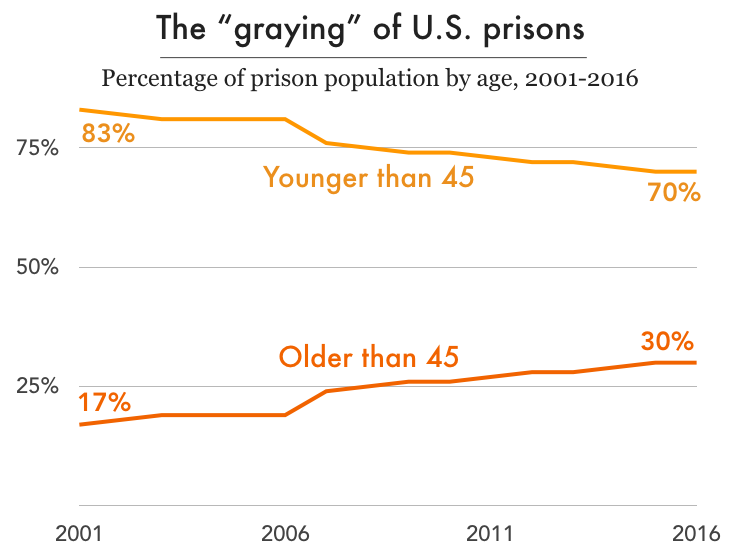
Data Source: Sources: Bureau of Justice Statistics, Mortality in State and Federal Prisons, 2001-2016 and Mortality in Local Jails and State Prisons, 2000-2013. (Graph: Emily Widra, 2020)
This graph originally appeared in Deaths in state prisons are on the rise, new data shows. What can be done?.
Events
- April 15-17, 2025:
Sarah Staudt, our Director of Policy and Advocacy, will be attending the MacArthur Safety and Justice Challenge Network Meeting from April 15-17 in Chicago. Drop her a line if you’d like to meet up!
Not near you?
Invite us to your city, college or organization.


