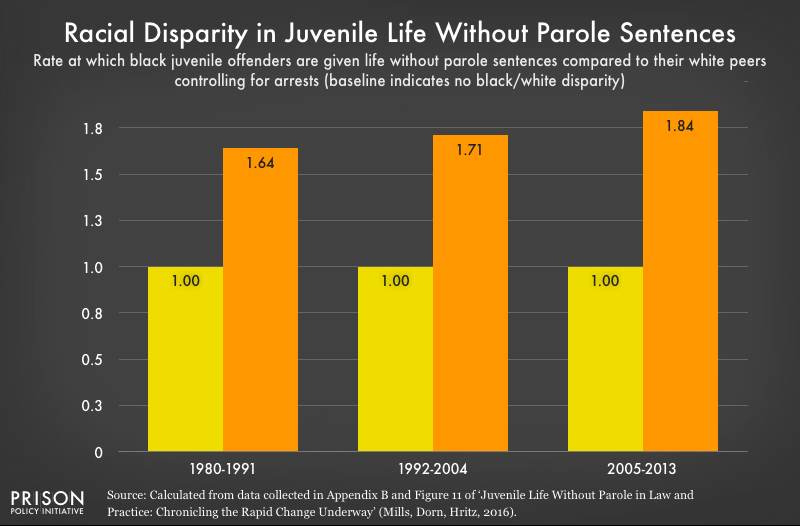
Data Source: Calculated from data collected in Appendix B of ‘Juvenile Life Without Parole in Law and Practice: Chronicling the Rapid Change Underway’ (Mills, Dorn, Mritz, 2016). (Graph: Joshua Aiken, 2016)
This graph originally appeared in Why do we lock juveniles up for life and throw away the key? Race plays a big part.
The Philips Black Project data controls for differences in policing practices to identify increasingly racially disparate outcomes that originate with prosecutors and the courts.


Events
- March 19, 2025:
Join Prison Policy Initiative’s Advocacy Department at 1 PM EST on Wednesday, March 19, 2025, for a webinar about understanding recidivism. We will cover strategies from our recidivism toolkit, including an overview of recidivism statistics and what they really mean, how to combat the “Willie Horton” effect, and ways that advocates can transform the narrative around reentry to make it less focused on negative outcomes and more focused on the ways that returning citizens contribute to their communities.
Not near you?
Invite us to your city, college or organization.