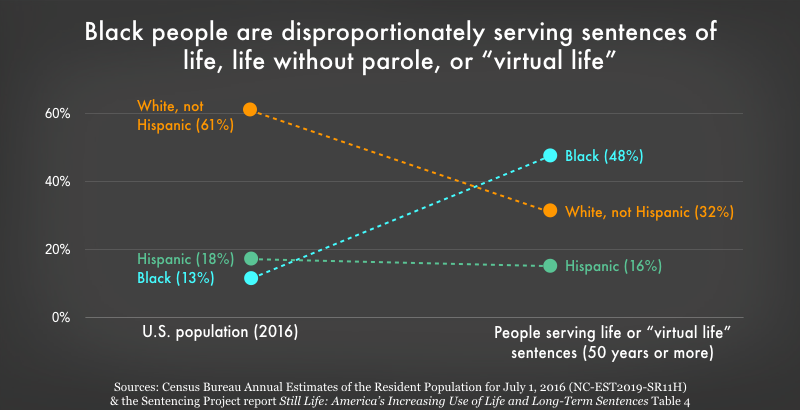
Data Source: Sources: Census Bureau Annual Estimates of the Resident Population for July 1, 2016 (NC-EST2019-SR11H) & the Sentencing Project report Still Life: America’s Increasing Use of Life and Long-Term Sentences Table 4. (Graph: Wendy Sawyer, 2020)
This graph originally appeared in Visualizing the racial disparities in mass incarceration.
Events
- April 15-17, 2025:
Sarah Staudt, our Director of Policy and Advocacy, will be attending the MacArthur Safety and Justice Challenge Network Meeting from April 15-17 in Chicago. Drop her a line if you’d like to meet up!
Not near you?
Invite us to your city, college or organization.


