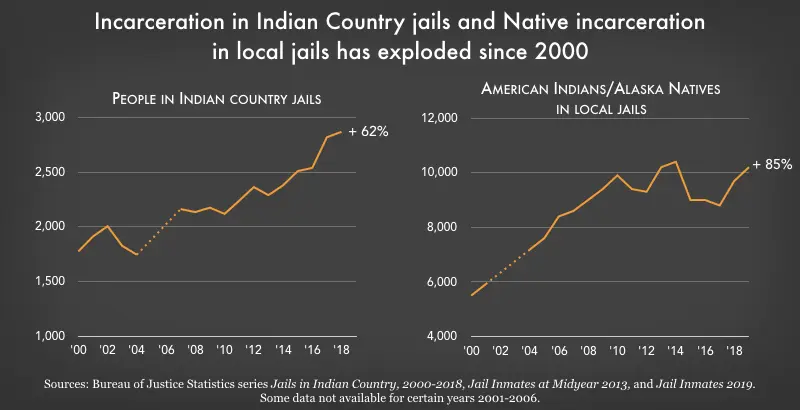
Data Source: Bureau of Justice Statistics series Jails in Indian Country, 2000-2018, Jail Inmates at Midyear 2013, and Jail Inmates 2019. (Graph: Wendy Sawyer, 2021)
This graph originally appeared in The U.S. criminal justice system disproportionately hurts Native people: the data, visualized.


