Data Source: For source and methodology details, see: www.prisonpolicy.org/reports/covidspread.html. (Graph: Wendy Sawyer, 2020)
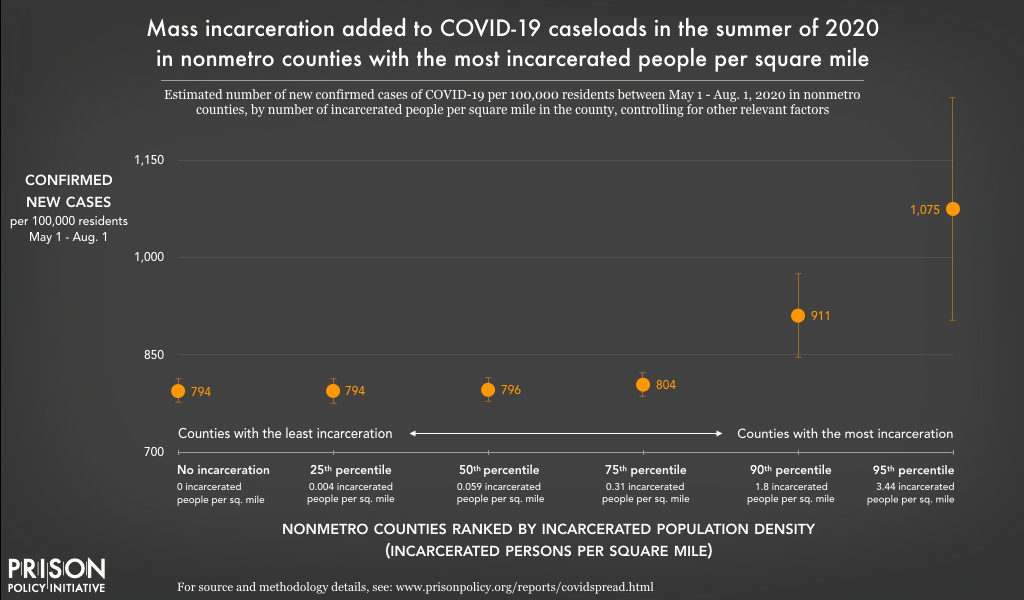
This graph originally appeared in Mass Incarceration, COVID-19, and Community Spread.
The estimated number of COVID-19 cases expected in nonmetro counties between May 1 and August 1, 2020, depending on the number of incarcerated people per square mile within the county (and controlling for other relevant factors). This chart displays point estimates (as circles), and the upper and lower bounds of the 95% confidence interval (the vertical lines). This chart shows that, all else being equal, nonmetro counties with high incarcerated population densities (such as rural counties with large prisons) had more new cases of the novel coronavirus than nonmetro counties with less incarceration did between May 1 and August 1, 2020. In counties with incarcerated population densities placing them in the top 10% of all nonmetro counties, the case rate per 100,000 residents was at least about 15% higher (90th percentile) and even over 35% higher (95th percentile) than those with little to no incarceration.
Events
- April 15-17, 2025:
Sarah Staudt, our Director of Policy and Advocacy, will be attending the MacArthur Safety and Justice Challenge Network Meeting from April 15-17 in Chicago. Drop her a line if you’d like to meet up!
Not near you?
Invite us to your city, college or organization.


