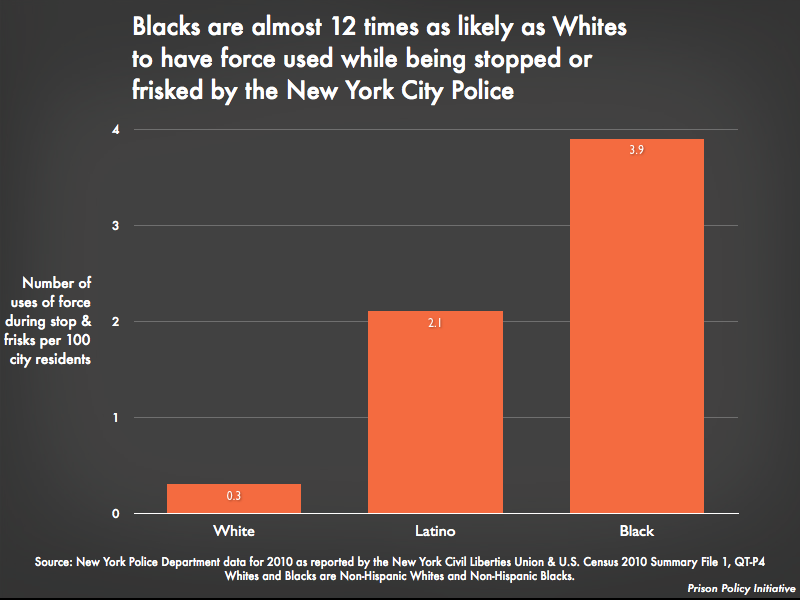
Data Source: New York Police Department data for 2010 as reported by the New York Civil Liberties Union & U.S. Census 2010 Summary File 1, QT-P4. (Graph: Prison Policy Initiative, 2012)
This graph originally appeared in Patting down the data on racial profiling in New York City.


