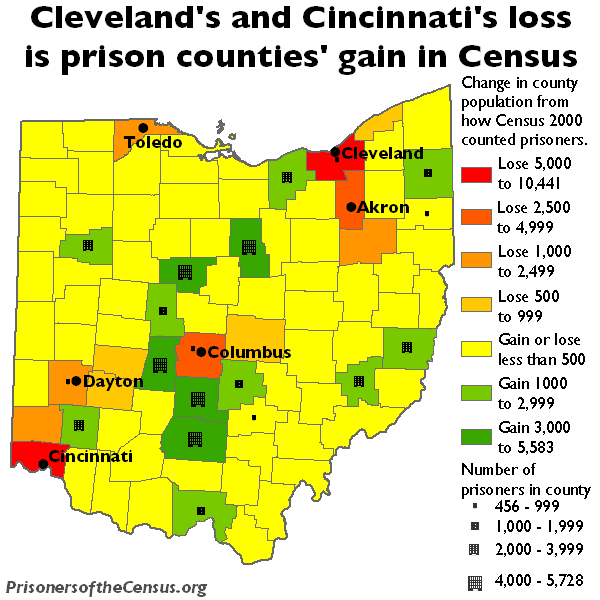
Data Source: This map relies on Ohio Department of Rehabilitation and Corrections (DRC) data on the county of commitment distribution for all state prisoners admitted to custody during the year 2000. This data was then extrapolated to apply to the entire population under DRC custody in 2000. We verified that each state prison facility identified by the U.S. Census was in fact a state prison, and then we performed our analysis of facility size with the numbers reported in the Census. (Map: Peter Wagner, 2004)
This map originally appeared in Importing Constituents: Prisoners and Political Clout in Ohio.


