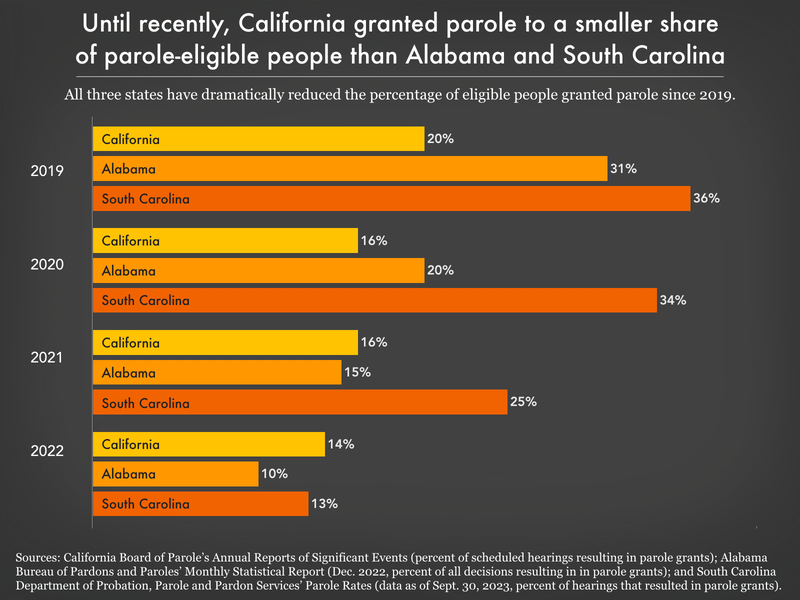
Data Source: California Board of Parole's Annual Reports of Significant Events (percent of scheduled hearings resulting in parole grants); Alabama Bureau of Pardons and Paroles' Monthly Statistical Report (Dec. 2022); and South Carolina Department of Probation, Parole and Pardon Services' Parole Rates (data as of Sept. 30, 2023). (Graph: Wendy Sawyer, 2023)
This graph originally appeared in Going back to Cali: Revisiting California’s parole release system.
Events
- April 15-17, 2025:
Sarah Staudt, our Director of Policy and Advocacy, will be attending the MacArthur Safety and Justice Challenge Network Meeting from April 15-17 in Chicago. Drop her a line if you’d like to meet up!
Not near you?
Invite us to your city, college or organization.


