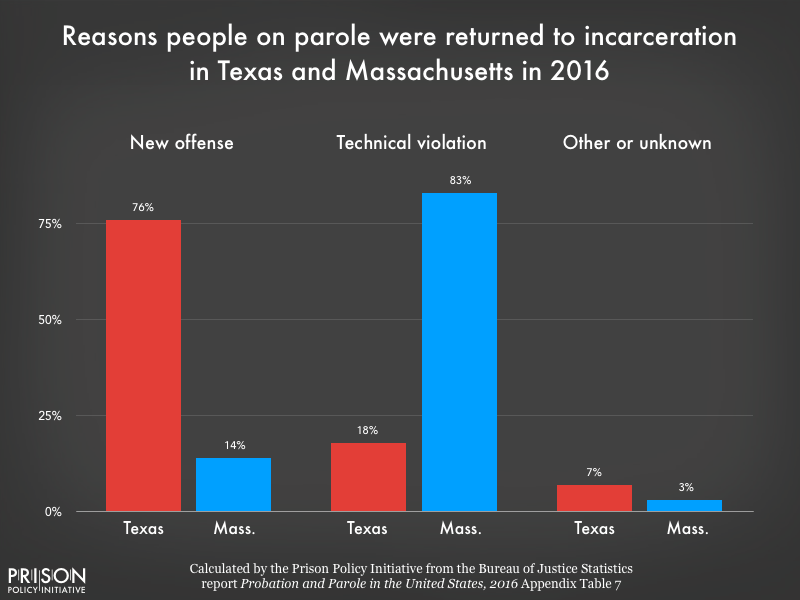
Data Source: Calculated by the Prison Policy Initiative from the Bureau of Justice Statistics report Probation and Parole in the United States, 2016 Appendix Table 7. (Graph: Wendy Sawyer, 2019)
This graph originally appeared in Red states, blue states: What do these mean for people on parole?.
Events
- April 15-17, 2025:
Sarah Staudt, our Director of Policy and Advocacy, will be attending the MacArthur Safety and Justice Challenge Network Meeting from April 15-17 in Chicago. Drop her a line if you’d like to meet up!
Not near you?
Invite us to your city, college or organization.


