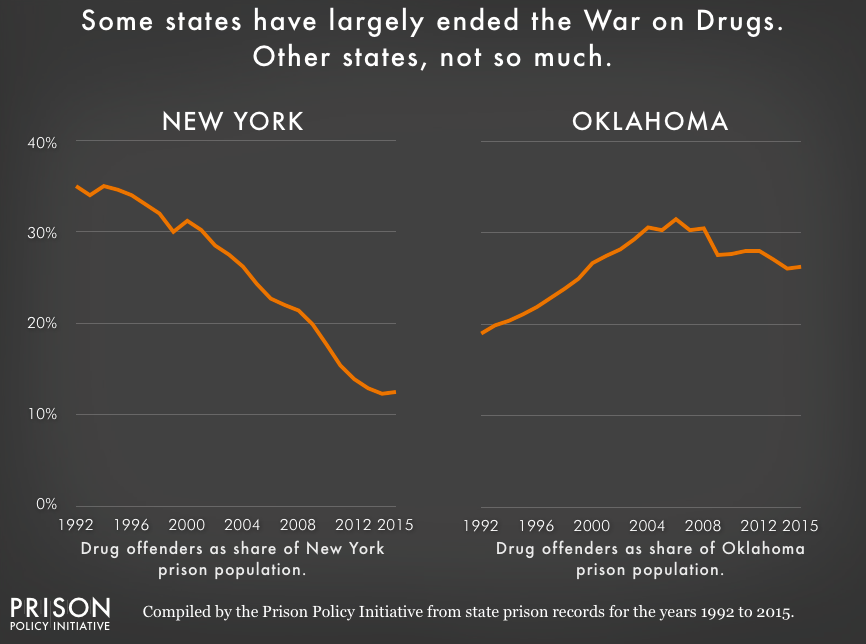
Data Source: Compiled by the Prison Policy Initiative from state prison records for the years 1992-2014. (Graph: Peter Wagner & Bernadette Rabuy, 2017)
This graph originally appeared in Mass Incarceration: The Whole Pie 2017.
Chart showing the portion of New York State's and Oklahoma's state prison population that is incarcerated for a drug offense from 1992 to 2015. The portion of New York State's prison population that is incarcerated for drug offenses has been consistently falling, while Oklahoma's rose to a peak in 2006 and has been consistently above 25% since 1999.
Events
- April 15-17, 2025:
Sarah Staudt, our Director of Policy and Advocacy, will be attending the MacArthur Safety and Justice Challenge Network Meeting from April 15-17 in Chicago. Drop her a line if you’d like to meet up!
Not near you?
Invite us to your city, college or organization.


