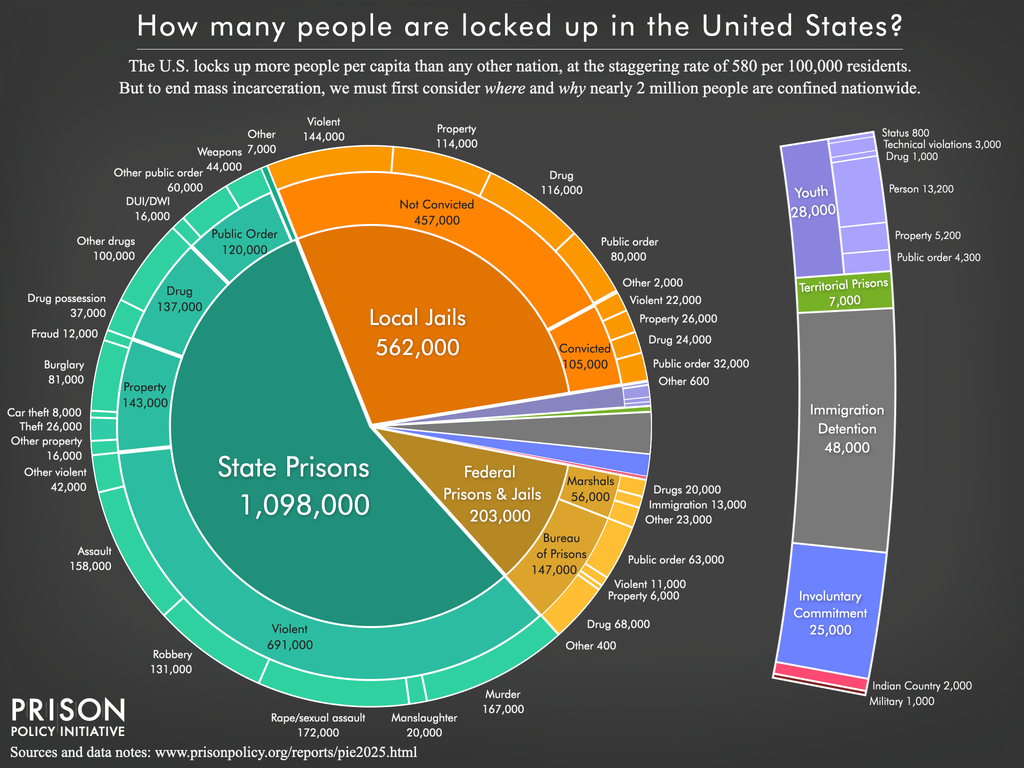
Data Source: See the Data sources & methodology section of the full Whole Pie report. (Graph: Wendy Sawyer and Peter Wagner, 2025)
This graph originally appeared in Mass Incarceration: The Whole Pie 2025.
The U.S. locks up more people per capita than any other independent democracy, at the staggering rate of 580 per 100,000 residents. But to end mass incarceration, we must first consider where and why nearly 2 million people are confined nationwide.
Events
- April 15-17, 2025:
Sarah Staudt, our Director of Policy and Advocacy, will be attending the MacArthur Safety and Justice Challenge Network Meeting from April 15-17 in Chicago. Drop her a line if you’d like to meet up!
Not near you?
Invite us to your city, college or organization.


