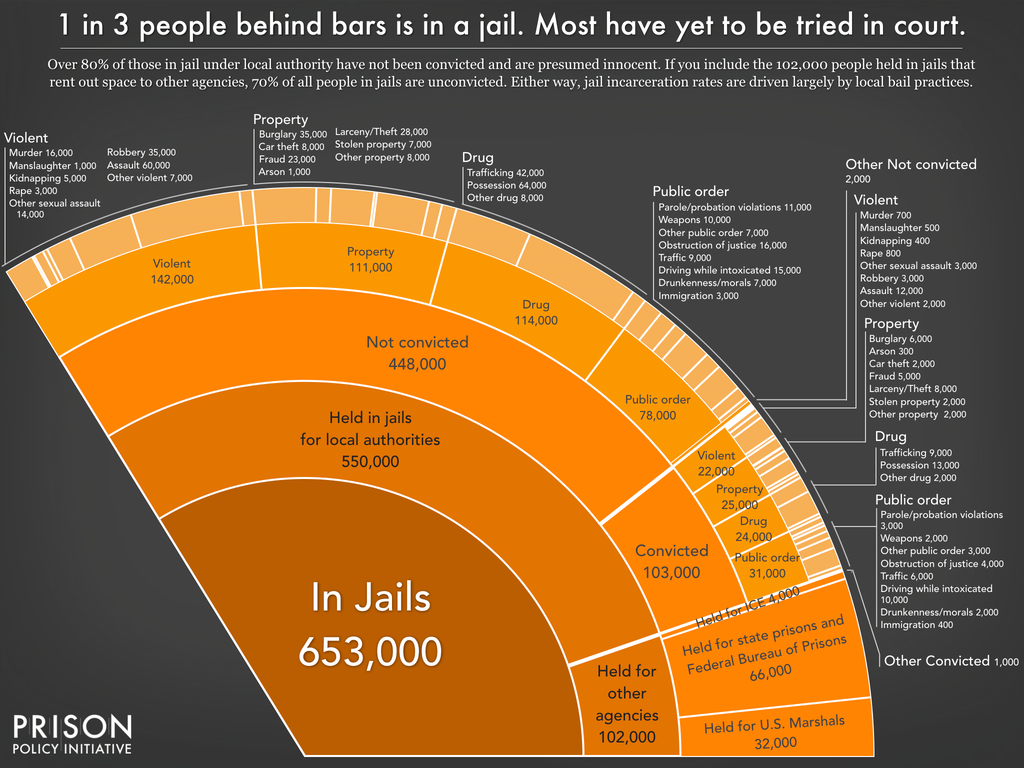
Data Source: See "Data sources" section of full report. (Graph: Wendy Sawyer & Peter Wagner, 2024)
This graph originally appeared in Mass Incarceration: The Whole Pie 2024.

Data Source: See "Data sources" section of full report. (Graph: Wendy Sawyer & Peter Wagner, 2024)
This graph originally appeared in Mass Incarceration: The Whole Pie 2024.