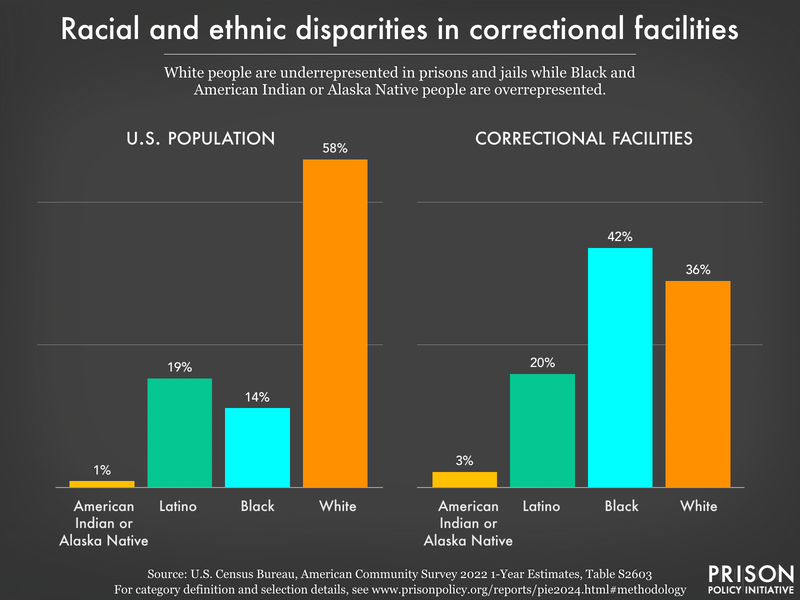
Data Source: U.S. Census Bureau, American Community Survey 2022 1-Year Estimates, Table S2603. (Graph: Wendy Sawyer, 2024)
This graph originally appeared in Mass Incarceration: The Whole Pie 2024.
Events
- March 19, 2025:
Join Prison Policy Initiative’s Advocacy Department at 1 PM EST on Wednesday, March 19, 2025, for a webinar about understanding recidivism. We will cover strategies from our recidivism toolkit, including an overview of recidivism statistics and what they really mean, how to combat the “Willie Horton” effect, and ways that advocates can transform the narrative around reentry to make it less focused on negative outcomes and more focused on the ways that returning citizens contribute to their communities.
Not near you?
Invite us to your city, college or organization.


