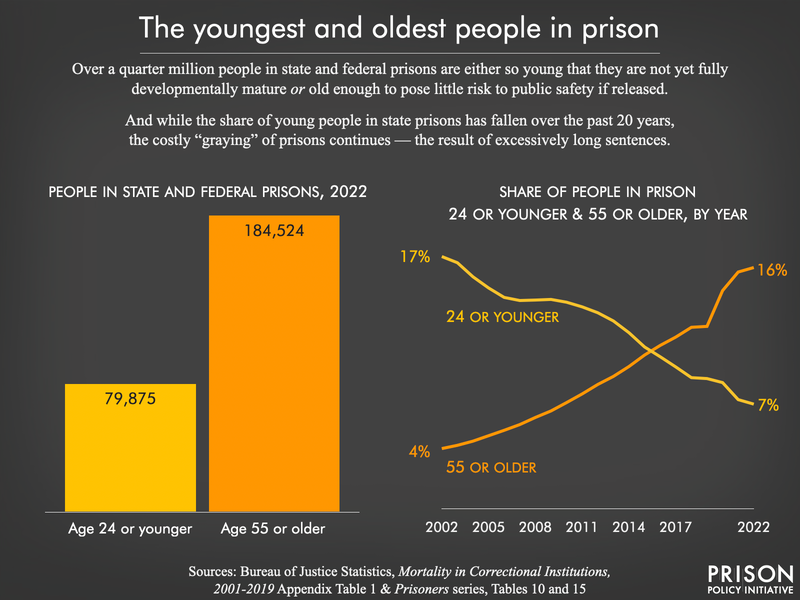
Data Source: Bureau of Justice Statistics, Mortality in Correctional Institutions, 2001-2019 Appendix Table 1 & Prisoners series, Tables 10 and 15. (Graph: Wendy Sawyer, 2025)
This graph originally appeared in Mass Incarceration: The Whole Pie 2025.
This graphic is an updated version of one we made for our 2022 report Beyond the Count. Unlike the original, the charts here include people in federal prisons.
Events
- April 15-17, 2025:
Sarah Staudt, our Director of Policy and Advocacy, will be attending the MacArthur Safety and Justice Challenge Network Meeting from April 15-17 in Chicago. Drop her a line if you’d like to meet up!
Not near you?
Invite us to your city, college or organization.


