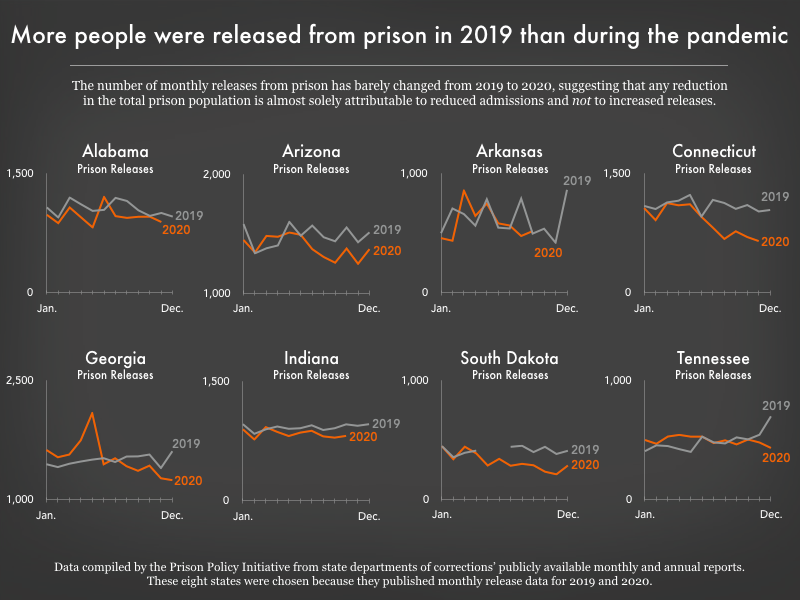
Data Source: Data compiled by the Prison Policy Initiative from state departments of corrections’ publicly available monthly and annual reports. These eight states were chosen because they published monthly release data for 2019 and 2020. (Graph: Emily Widra, 2021)
This graph originally appeared in How much have COVID-19 releases changed prison and jail populations?.
Events
- April 15-17, 2025:
Sarah Staudt, our Director of Policy and Advocacy, will be attending the MacArthur Safety and Justice Challenge Network Meeting from April 15-17 in Chicago. Drop her a line if you’d like to meet up!
Not near you?
Invite us to your city, college or organization.


