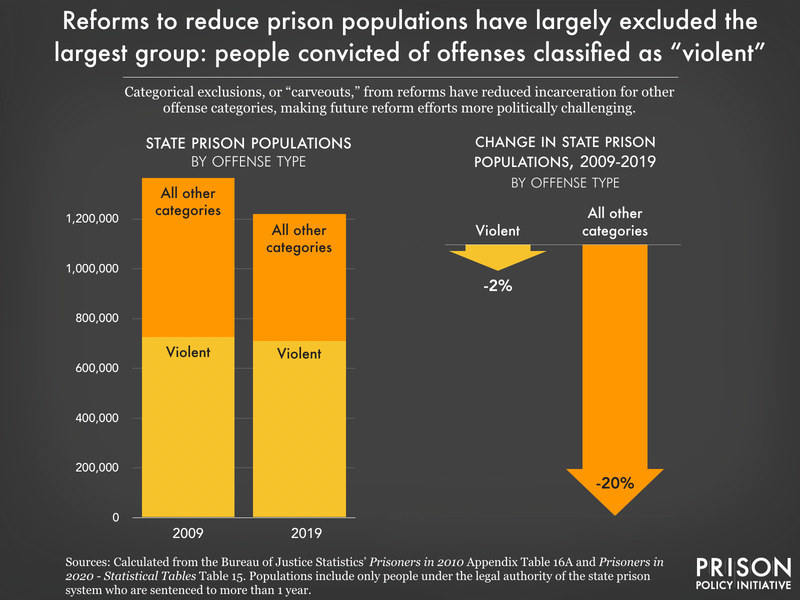
Data Source: Bureau of Justice Statistics' Prisoners in 2010 Appendix Table 16A and Prisoners in 2020 — Statistical Tables Table 15. (Graph: Wendy Sawyer, 2024)
This graph originally appeared in Contending with Carveouts: How and Why to Resist Charge-Based Exclusions in Reforms.
Events
- April 15-17, 2025:
Sarah Staudt, our Director of Policy and Advocacy, will be attending the MacArthur Safety and Justice Challenge Network Meeting from April 15-17 in Chicago. Drop her a line if you’d like to meet up!
Not near you?
Invite us to your city, college or organization.


