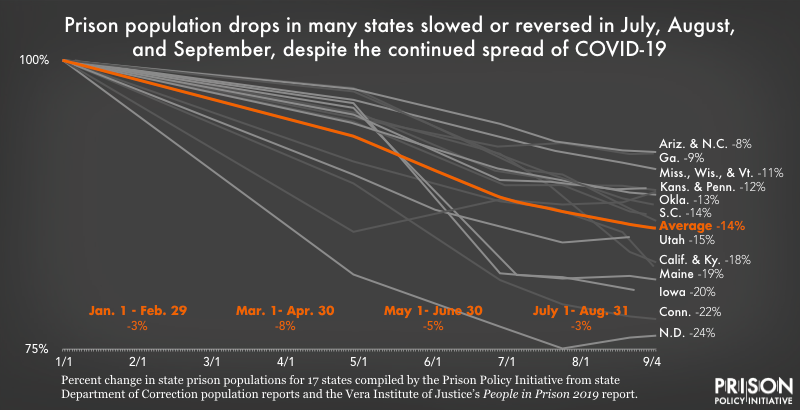
Data Source: Percent change in state prison populations for 17 states compiled by the Prison Policy Initiative from state Department of Correction population reports and the Vera Institute of Justice's People in Prison 2019 report. (Graph: Emily Widra, 2020)
This graph originally appeared in Visualizing changes in the incarcerated population during COVID-19.
Events
- April 15-17, 2025:
Sarah Staudt, our Director of Policy and Advocacy, will be attending the MacArthur Safety and Justice Challenge Network Meeting from April 15-17 in Chicago. Drop her a line if you’d like to meet up!
Not near you?
Invite us to your city, college or organization.


