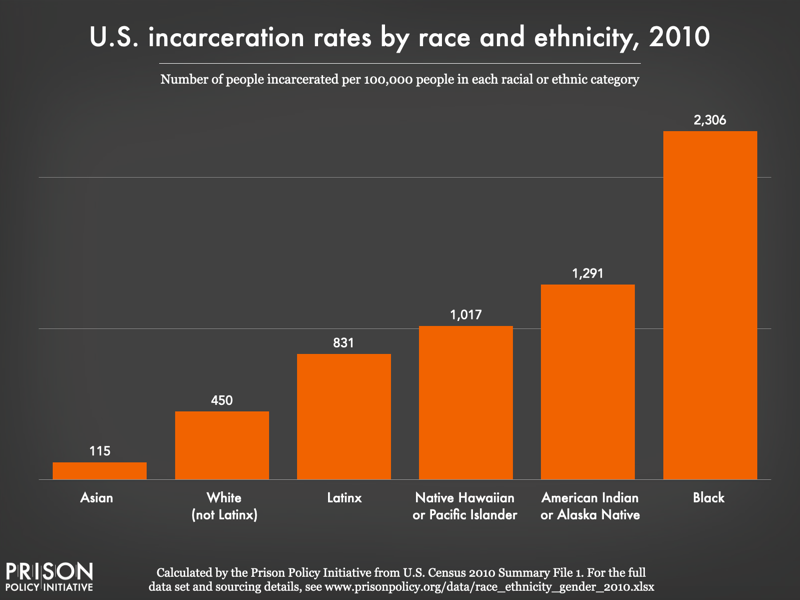
Data Source: Calculated by the Prison Policy Initiative from U.S. Census 2010 Summary File 1. For full sourcing details, see the full data set in Excel. (Graph: Wendy Sawyer, 2020)
For 2010 incarceration rates by race/ethnicity in each of the 50 states, see our report, Breaking Down Mass Incarceration in the 2010 Census: State-by-State Incarceration Rates by Race/Ethnicity and the expanded analysis including gender available on our Data toolbox page.
See our other research for the big picture on mass incarceration or see the the graphs and other research we've produced about incarceration in your state.
This page is the most popular one on our website. If you appreciate this information, can you make a donation so we can continue to produce research for a more fair and just society?
Events
- April 15-17, 2025:
Sarah Staudt, our Director of Policy and Advocacy, will be attending the MacArthur Safety and Justice Challenge Network Meeting from April 15-17 in Chicago. Drop her a line if you’d like to meet up!
Not near you?
Invite us to your city, college or organization.


