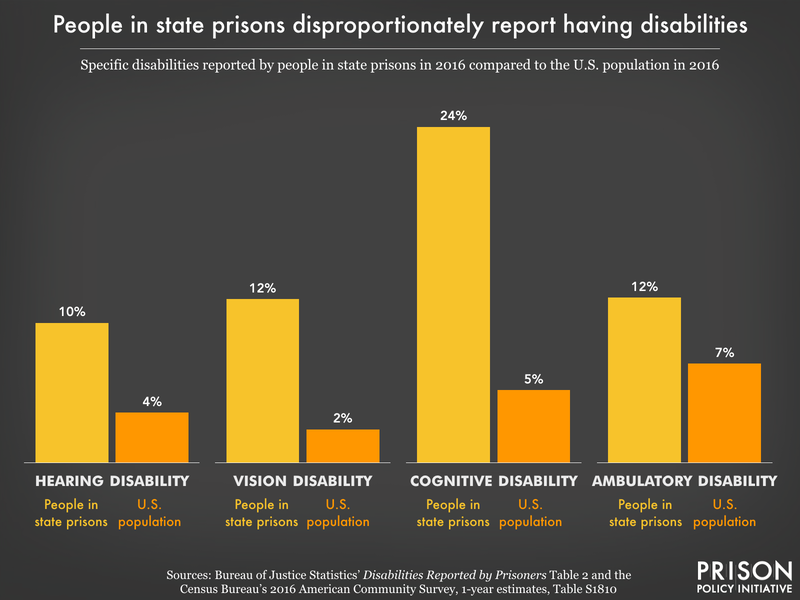
Data Source: Bureau of Justice Statistics’ Disabilities Reported by Prisoners Table 2 and the Census Bureau's 2016 American Community Survey, 1-year estimates, Table S1810. (Graph: Wendy Sawyer, 2022)
This graph originally appeared in Chronic Punishment: The unmet health needs of people in state prisons.
Events
- April 15-17, 2025:
Sarah Staudt, our Director of Policy and Advocacy, will be attending the MacArthur Safety and Justice Challenge Network Meeting from April 15-17 in Chicago. Drop her a line if you’d like to meet up!
Not near you?
Invite us to your city, college or organization.


