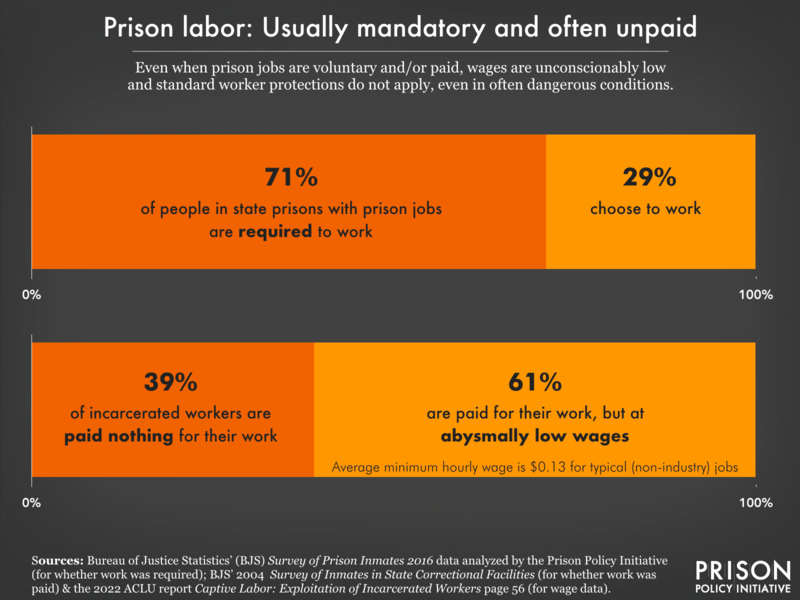
Data Source: Bureau of Justice Statistics' Survey of Prison Inmates, 2016 data analyzed by the Prison Policy Initiative (for whether work was required), Bureau of Justice Statistics' 2004 Survey of Inmates in State Correctional Facilities (for whether work was paid), and ACLU's Captive Labor: Exploitation of Incarcerated Workers, page 56 (wage data). (Graph: Wendy Sawyer, 2022)
This graph originally appeared in The state prison experience: Too much drudgery, not enough opportunity.
Data note: The last time the data were collected by the Bureau of Justice Statistics (BJS) on how many workers are paid was in 2004. But in 2022, six states (Ala., Ark., Fla., Ga., S.C., and Texas) still paid nothing for most or all jobs done by incarcerated people, and together, these states made up 30% of state prison populations nationwide in 2019, suggesting that the percentage of workers who are unpaid has likely not changed much since the 2004 survey.
Events
- April 15-17, 2025:
Sarah Staudt, our Director of Policy and Advocacy, will be attending the MacArthur Safety and Justice Challenge Network Meeting from April 15-17 in Chicago. Drop her a line if you’d like to meet up!
Not near you?
Invite us to your city, college or organization.


