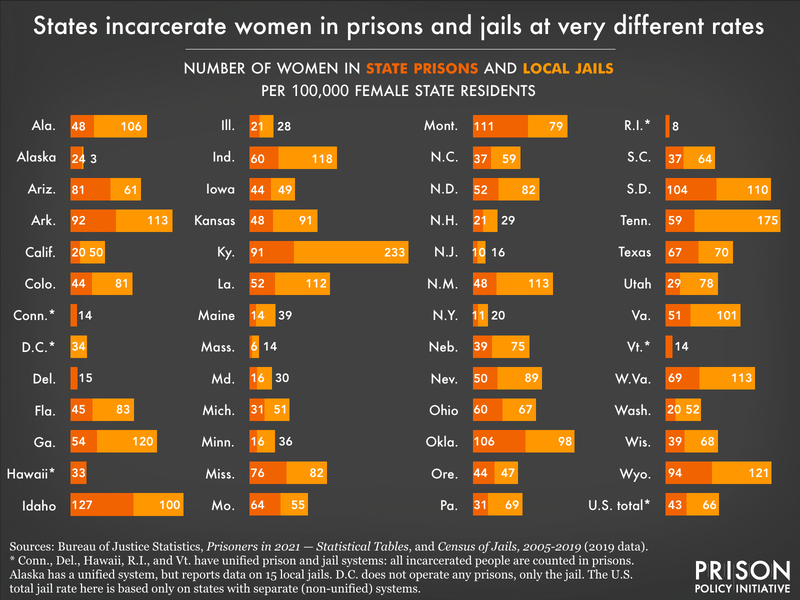
Data Source: Bureau of Justice Statistics' Prisoners in 2021 — Statistical Tables, and Census of Jails, 2005-2019 (2019 data). (Graph: Leah Wang, 2023)
This graph originally appeared in Updated data and charts: Incarceration stats by race, ethnicity, and gender for all 50 states and D.C.
Jails play an outsize role in the mass incarceration of women, which has serious consequences for their health and their families. States that have a single, “unified” prison and jail system report all incarceration data as prison data, so no separate jail incarceration rate is available for them (this includes Conn., Del., Hawaii, R.I., and Vt.). Washington, D.C., meanwhile, only reports jail data; its prison population is included in the federal system.
Events
- April 15-17, 2025:
Sarah Staudt, our Director of Policy and Advocacy, will be attending the MacArthur Safety and Justice Challenge Network Meeting from April 15-17 in Chicago. Drop her a line if you’d like to meet up!
Not near you?
Invite us to your city, college or organization.


