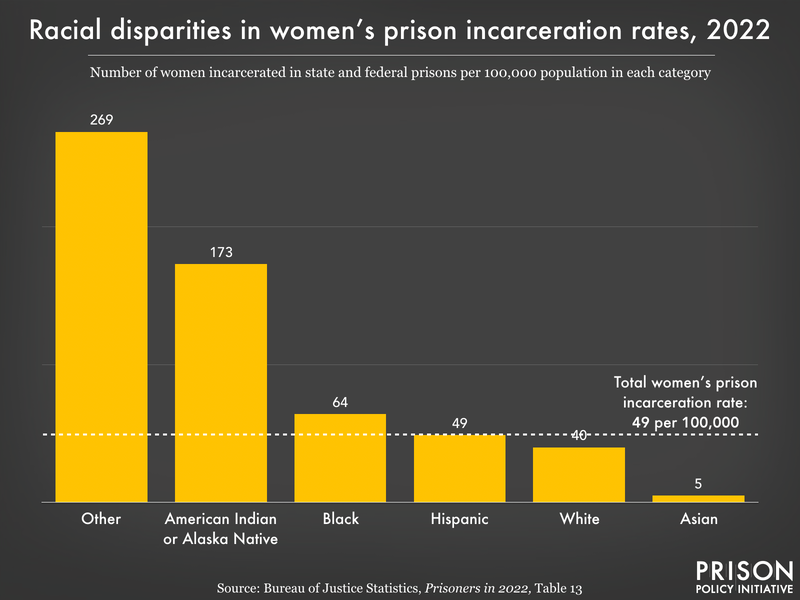
Chart showing American Indian or Alaska Native women are incarcerated in prison at the highest rate of any single race category, 173 per 100,000.

Data Source: Bureau of Justice Statistics, Prisoners in 2022, Table 13. (Graph: Leah Wang, 2024)

This graph originally appeared in Updated charts show the magnitude of prison and jail racial disparities, pretrial populations, correctional control, and more.
Stay Informed

Get the latest updates:


And our other newsletters:


Stay Informed


Get the latest updates:


Share on 𝕏 Donate


Events

Not near you?
Invite us to your city, college or organization.