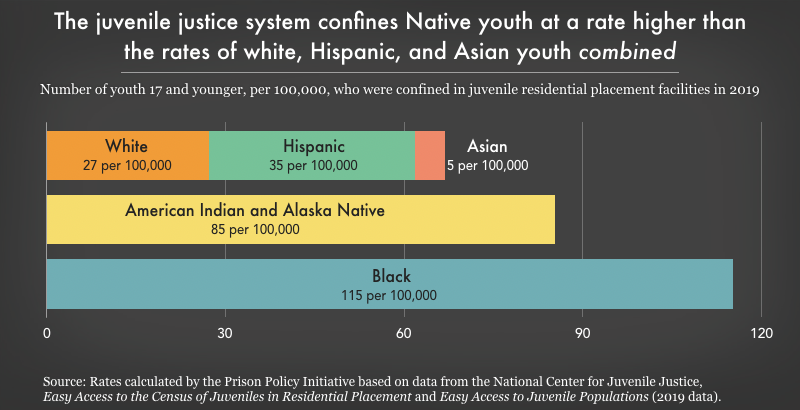
Data Source: Rates calculated by the Prison Policy Initiative based on data from the National Center for Juvenile Justice, Easy Access to the Census of Juveniles in Residential Placement and Easy Access to Juvenile Populations (2019 data). (Graph: Leah Wang, 2021)
This graph originally appeared in The U.S. criminal justice system disproportionately hurts Native people: the data, visualized.


